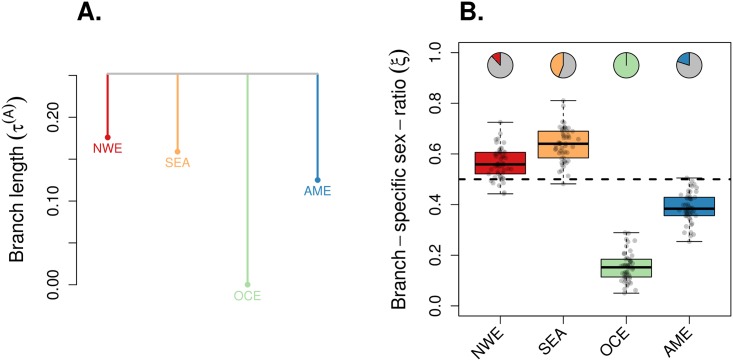
Fig 7. Application example on whole-genome human sequence data.
We re-analyzed a subset of the whole-genome sequence data from Pagani et al. [33], with populations from NW-Europe (NWE), SE-Asia (SEA), Oceania (OCE) and Americas (AME) (see the Materials and methods section for a detailed composition of populations). For both genetic systems, we randomly subsampled 50 pseudo-replicated datasets from the full data, each made of 5,000 autosomal SNPs and 5,000 X-linked SNPs. We ran KimTree considering the best fitting tree topology (NWE,SEA,OCE,AME) (see the Materials and methods section), represented in (A) with branch lengths estimates corresponding to the posterior means of . (B) The boxplots summarize the distributions of the posterior means of the ESR for each branch in the tree, for the 50 pseudo-replicated datasets. The dotted line indicates the expectation for a balanced ESR (ξi = 0.5). The pie-charts indicate the fraction of significant support values (S < 0.01) against the hypothesis ξ = 0.5 (see Eq 4).

