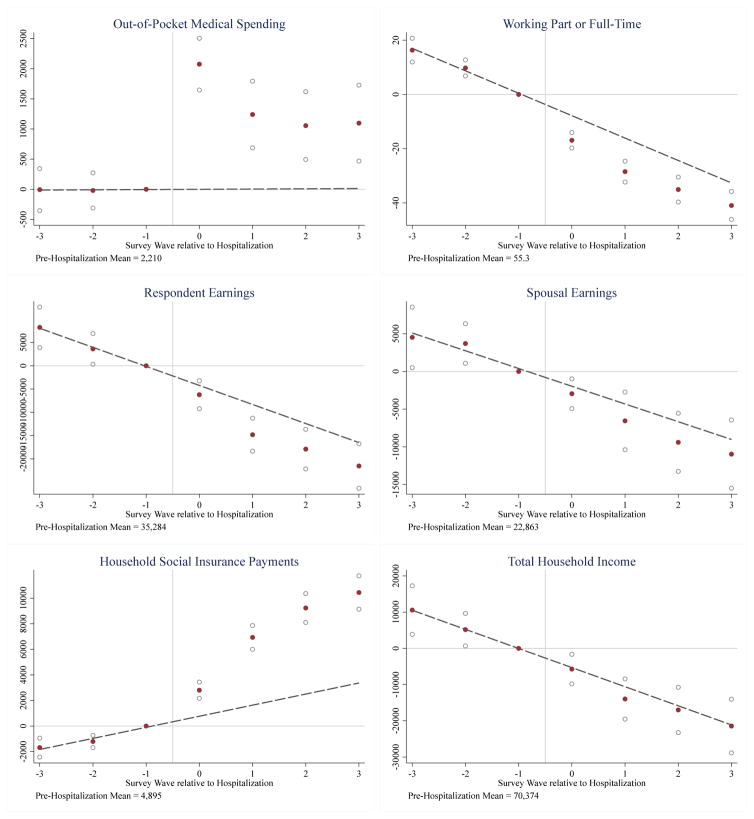
Figure 2.
Impact of Hospitalization for the Insured Ages 60 to 64 in the HRS
Notes: The sample is the insured ages 60 to 64. The points in each figure represent the estimated effects of event time (i.e. the μr’s from the non-parametric event study in equation 3), with the survey wave reporting the hospitalization normalized to zero. Survey waves are biannual; we assume the hospitalization occurs halfway between survey waves (12 months prior to survey wave zero) on average. The hollow circles present the 95% confidence intervals. The dashed line represents the estimated pre-admission linear relationship between outcome and event time from the parametric event study in equation 4 with the level normalized to match the non-parametric estimates. All estimates are weighted using survey weights.

