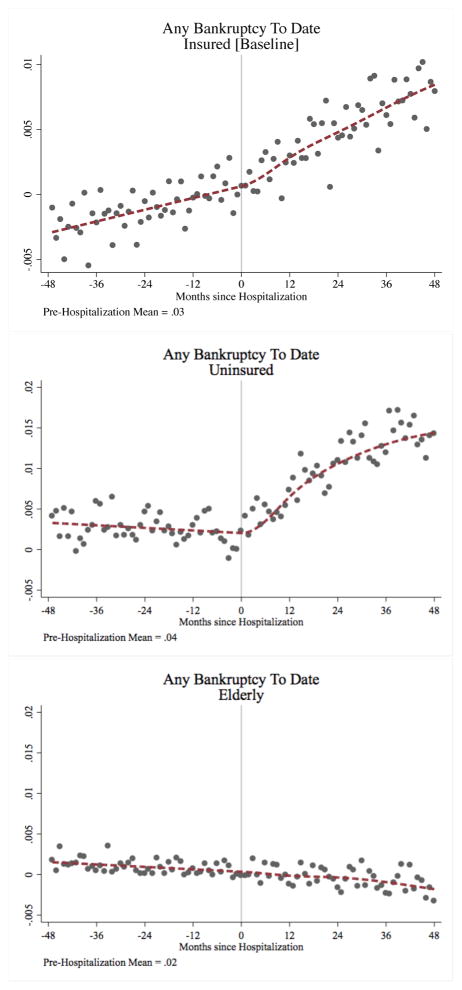
Figure 5.
Impact of Hospitalization on Bankruptcy
Notes: Samples are non-elderly insured, uninsured, and the elderly (see Appendix Table 13, columns 3, 6, and 9). The months on the x-axis are defined relative to the index admission. The points in each figure represent the estimated effects of event time (i.e. the μr’s from the non-parametric event study in equation 3). The dashed line represents the estimated event study coefficients from the parametric event study in equation 5 with the level normalized to match the non-parametric estimates. All estimates are weighted to account for individuals’ sampling probabilities.

