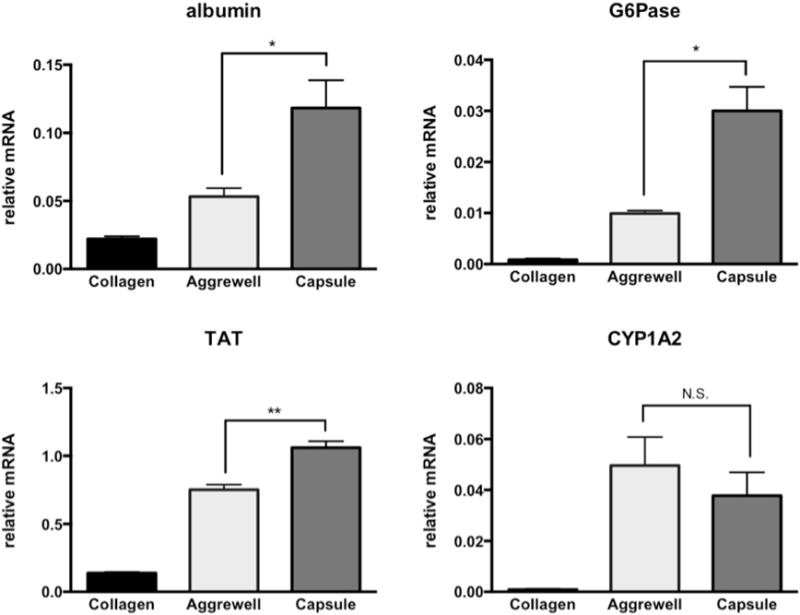
Figure 6. Analysis of hepatic gene expression.

qPCR results indicate encapsulated spheroids expressed higher levels of albumin and metabolic genes (TAT and G6Pase) compared to 2D and 3D controls (Day 8). (n=3, * p<0.05, **p<0.01)

qPCR results indicate encapsulated spheroids expressed higher levels of albumin and metabolic genes (TAT and G6Pase) compared to 2D and 3D controls (Day 8). (n=3, * p<0.05, **p<0.01)