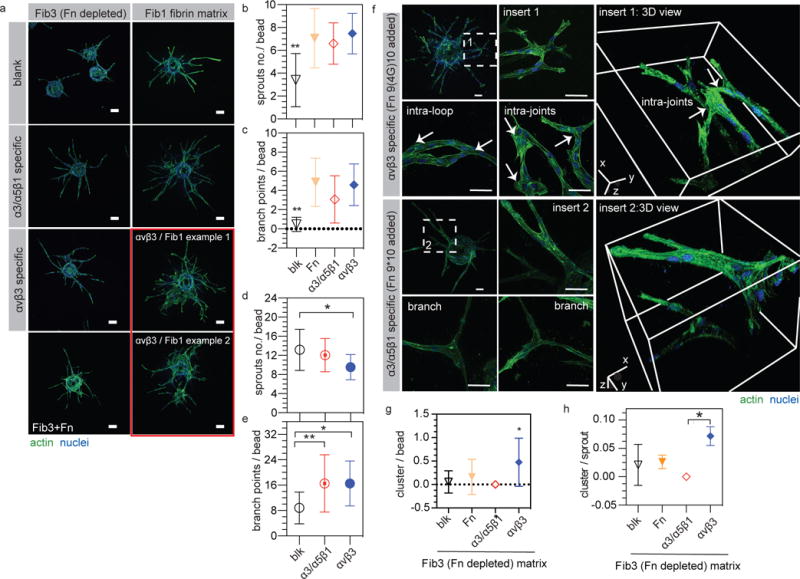
Figure 1. Endothelial cell sprouting in αvβ3 specific matrices displays clustered branches.

(a) HUVEC sprouting in FXIIIa stabilized fibronectin containing fibrin gel (Fib1) and fibronectin depleted fibribrin gel (Fib3). Scale bar: 100 μm. (b,c) Quantification of sprout number and branch points per bead in Fib3 matrices. (d,e) Quantification of sprout number and branch points per bead in Fib1 matrices. (f) Representative images and 3D views of HUVEC branch structures in both αvβ3 and α3/α5β1 specific Fib3 matrices. Intra-loop and intra-joint branch structures were observed in αvβ3 specific matrices while organized branch structures were observed in α3/α5β1 specific matrices. Scale bar: 50 μm. (g) Quantification of branch clusters per bead and (h) branch cluster number per sprout. Blank = blk = no fibronecitn fragment added, α3/α5β1 specific matrices = gel + 2μM Fn9*10, αvβ3 specific matrices = gel + 2μM Fn9(4G)10, Fn matrices = Fib3 gel + 1μM Fn. For all quantifications n ≥ 15 HUVEC coated beads, from 3 independent gels. Each bead is treated as its own independent sample. Statistical analyses were performed using Prism (GraphPad, San Diego, CA). Brown-Forsythe test was performed to ensure that the variance of the data is similar between the groups that are being statistically compared. Data were analyzed using a one-way analysis of variance (ANOVA) followed by a Tukey post-hoc test and a 95% confidence interval. All plots represent mean ± SD. * and ** indicate P < 0.05 and P < 0.01, respectively. An alternative statistical analysis for this data treating experiments performed on different days as the independent sample can be found on Figure S3.
