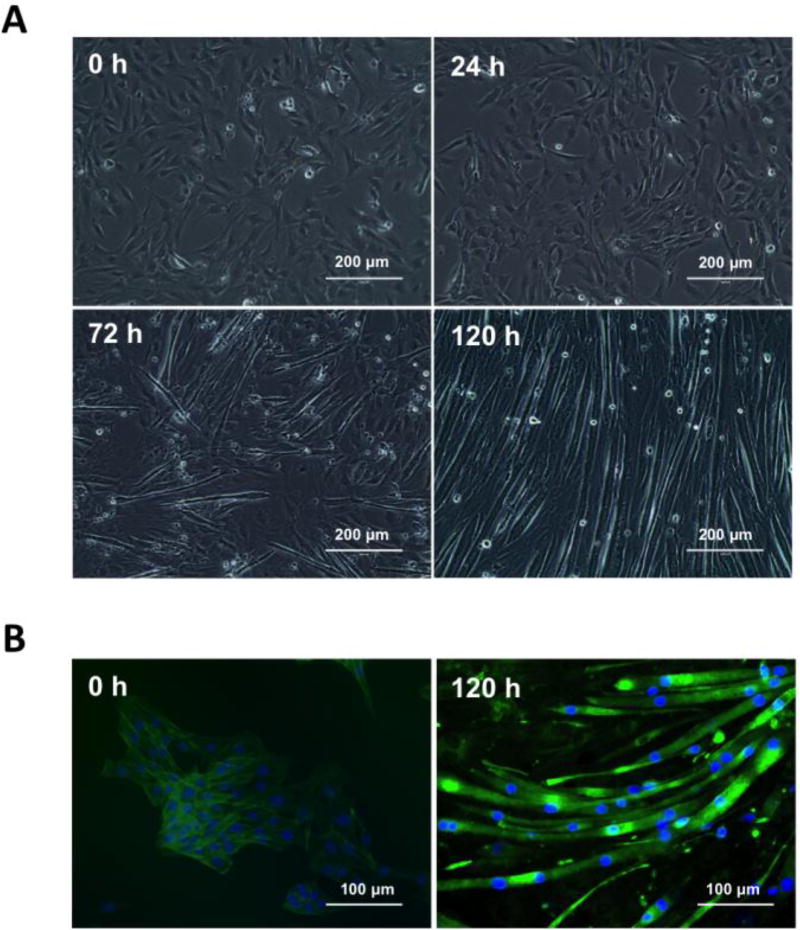
Figure 1. Live and fixed cells imaging of C2C12 differentiation.
(A) Representative images obtained from C2C12 cells seeded onto 12-well culture dishes illustrating their differentiation rate at 24, 72 and 120 h post incubation in DMEM with 2% horse serum (HS) (differentiation media). Images were recorded by transmitted-light microscopy using a 20× air objective (EVOS® XL Imaging System). Scale bar = 200 µm. (B) Representative images derived from C2C12 non-differentiated (day 0) and differentiated (day 5) cells cultured onto 12-well culture dishes. For visualization of cytoskeleton (F-actin filaments) and nuclei, formaldehyde fixed cells were stained with fluorescently-labeled phalloidin and Hoechst 33258 for 20 min at room temperature. Cell images were recorded by fluorescence microscopy (EVOS® FLoid® Cell Imaging Station). Scale bar = 100 µm.

