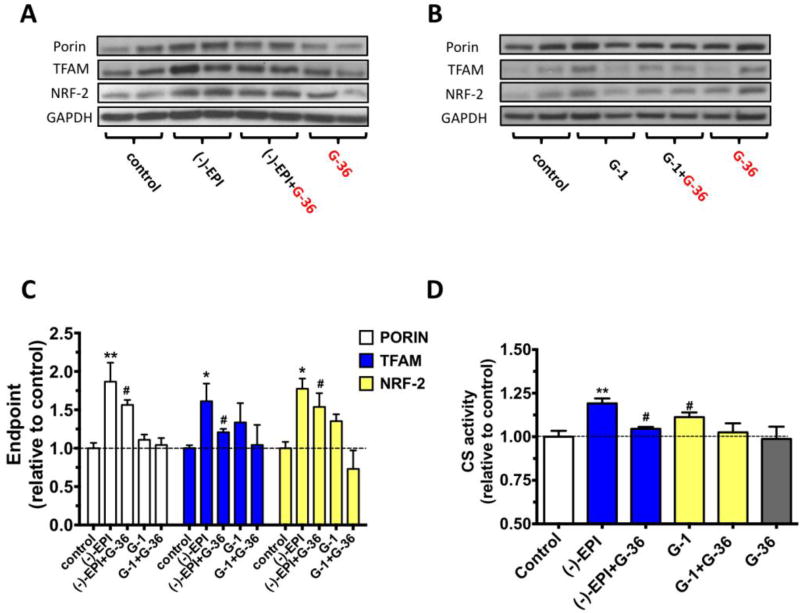
Figure 5. Effect of chemical blockade of GPER on (−)-epicatechin ((−)-EPI) induction of markers of mitochondrial biogenesis (MiB).
Representative immunoblots of porin, mitochondrial transcription factor A (TFAM) and nuclear respiratory factor-2 (NRF-2) protein levels after treatment with either 10 µM (−)-EPI (A) or 0.1 µM G-1 (B) (GPER agonist) for 48 h with or without 0.1 µM G-36 (GPER antagonist). (C) Quantification of porin, TFAM and NRF-2 protein levels by densitometric analysis. (D) Citrate synthase activity levels were measured in the supernatant of cell’s lysates treated with either vehicle, 10 µM (−)-EPI or 0.1 µM G-1 with or without 0.1 µM G-36 and values normalized by protein content. Data was normalized to the mean values of control (vehicle group) and expressed as mean ± S.E.M. derived from 4 independent experiments each in quadruplicate. *P≤ 0.05 vs. control, #P> 0.05 vs. control as analyzed by one-way ANOVA followed by the Dunnett’s post hoc test. Black horizontal intermittent line indicates the adjusted mean (1) of control (vehicle group) across all groups.

