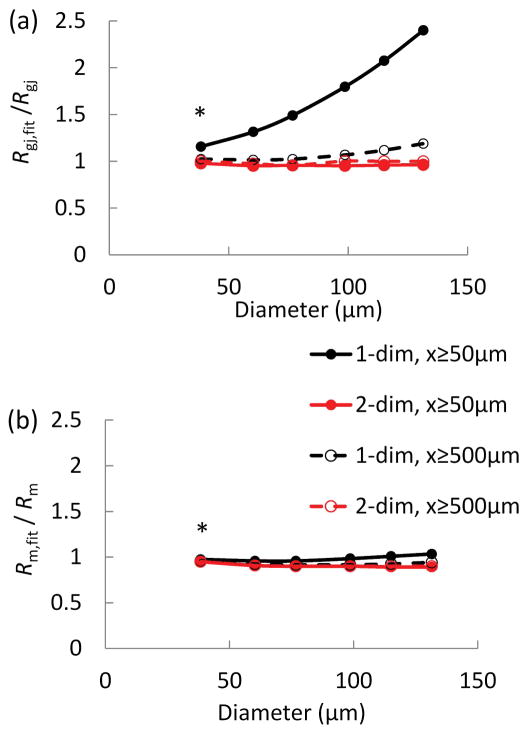
Figure 3.
(a–b) Estimations of the error for coupling resistance (a) and membrane resistance (b) as a function of endothelial tube circumference for different fitting schema. The discrete model with known Rm (= 11.9 GΩ) and Rgj (= 4.5 MΩ) (Fig. 1a) and control diameter Dcontrol = 38 μm was expanded in the circumferential direction to simulate hypothetical endothelial tubes with increasing diameters (D). Model predictions of ΔVm in response to current injection at xstim were used to simulate Vm measurements along an endothelial tube. The simulated ΔVm were fitted with one- and two-dimensional cable equations (Eqs. 10 and 16) to estimate Rgj,fit (a) and Rm,fit (b). The fittings were performed with ΔVm at x−xstim= 50, 500, 1000, 1500, and 2000 μm (in the axial direction) (diamond and square symbols), and ΔVm only at x−xstim≥ 500 μm (triangles and crosses). Fitting the two-dimensional equation recovers correctly Rgj and Rm (Rgj,fit/Rgj λ 1 and Rm,fit/Rm λ 1) for all diameters and data points (a, b squares and crosses). On the other hand, the one-dimensional equation overestimates Rgj (Rgj,fit/Rgj≫ 1) when applied to data with the 50 μm point from vessels > 50 μm in diameter (a, diamond symbols).

