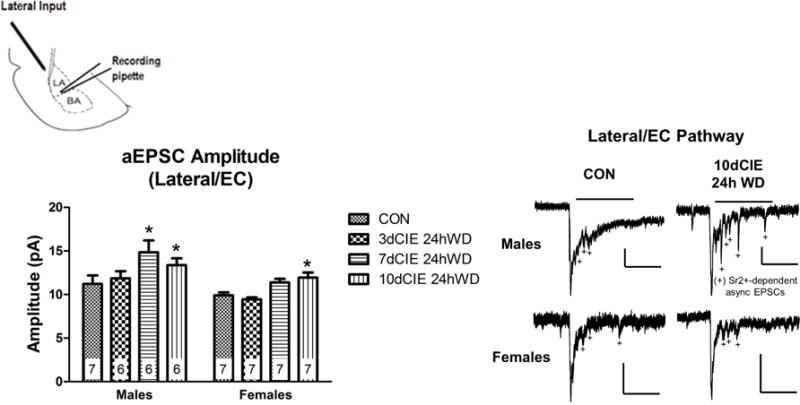
Fig. 4.

Chronic intermittent ethanol and withdrawal increased asynchronous EPSC amplitude at lateral/external capsule inputs after longer durations in males and females. Diagram showing the recording pipette in the lateral/basolateral amygdala and the stimulating electrode at the lateral input (top left). Summary of aEPSC amplitude data across the treatment groups and sexes. Numbers represents the ‘n’ (neurons) for each group. Representative traces in males and females (right). Scalar bars denote 250msec for all traces and either 50pA or 25pA (male 10dCIE 24h WD only). Bars above the traces indicate the 400msec window used to analyze aEPSC amplitude and frequency (see Methods). * denotes a significant difference with a 2-way ANOVA and Bonferroni’s post-hoc test (p<0.01) between CIE duration and control (CON).
