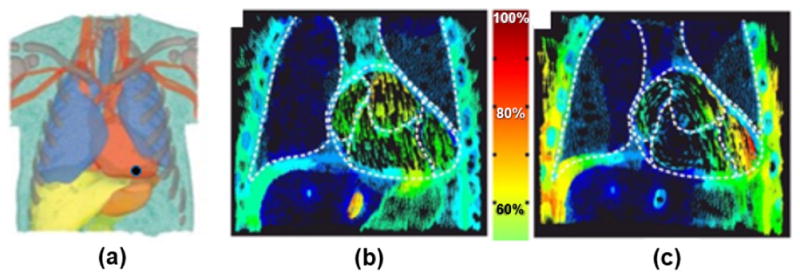
Fig. 16.

FE cardiac simulations using the XCAT105. (a) The XCAT-male FE model, position of the tip electrode is indicated with a black dot. Current density distribution in the XCAT model for (b) the electric field and (c) the magnetic field. The color scale in the middle indicates the portion of the current density.
