
Fig. 7.
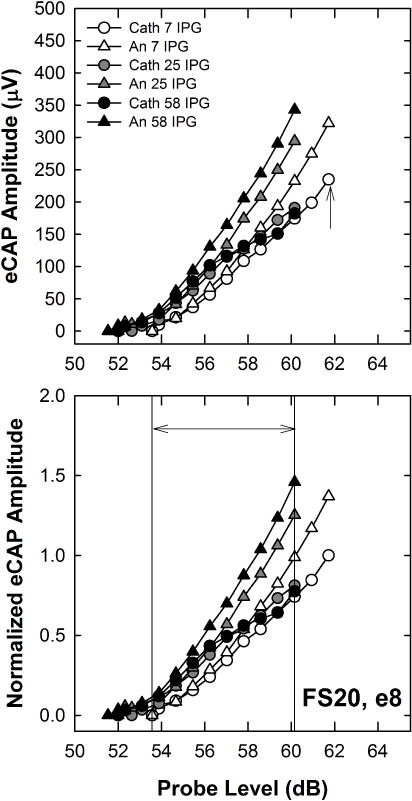
Top: Individual example of raw eCAP AGFs for both polarities (cathodic, circles; anodic, triangles) and all three IPGs (7, 25, and 58 μsec) for Cochlear subject FS20, electrode 8. Data are plotted similar to Fig. 2. Bottom: All AGFs were normalized to the highest amplitude of the AGF for the clinical default stimulus, which was cathodic-leading with 7-μsec IPG (Cath 7), indicated by the up-pointing arrow in the top panel. To obtain the average normalized amplitude for each polarity and IPG condition, normalized amplitudes within an AGF were averaged across a range of current levels that yielded eCAPs across all polarity/IPG conditions. This range is indicated by the double arrow between the two vertical lines in the bottom panel.