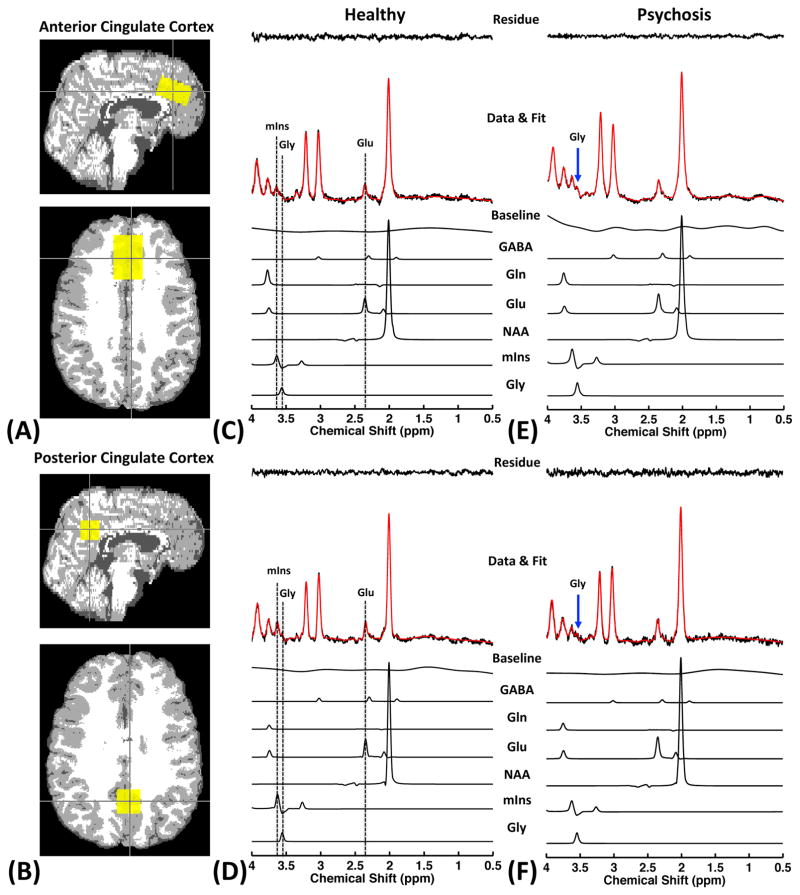
Figure 1.
Partial volume maps of tissue subtypes (GM: gray color; WM: white color; CSF: dark gray color) overlaid with reconstructed VOIs (yellow box) of 1H-MRS are shown (a: ACC, b: PCC). And representative TE-averaged proton spectra obtained from ACC and PCC of healthy control (c, d) and patient with psychosis (e, f) are also provided. Note that the Glu signal at 2.35 ppm is clearly resolved from the Gln and NAA resonances, and the Gly signal at 3.55 ppm is observed by suppressing the dominating mIns signal.

