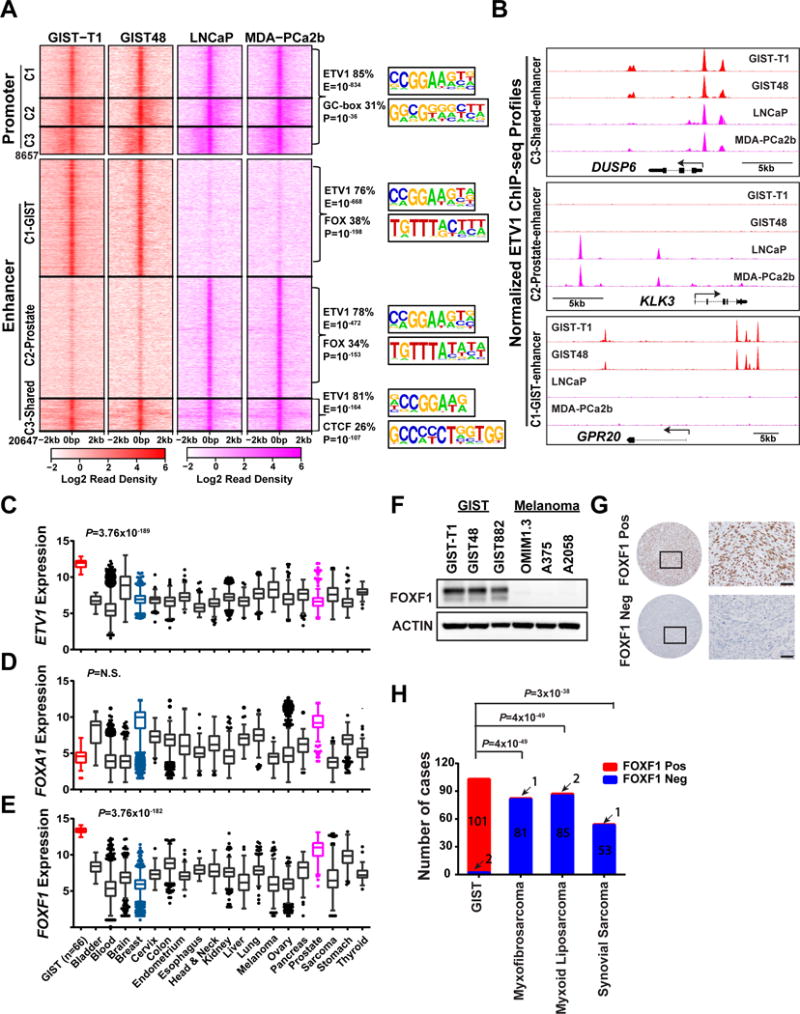
Figure 1. ETV1 cistrome analysis identifies FOXF1 as a uniquely and highly expressed transcription factor in GIST.

A, Left panel: Heatmap of ETV1 binding sties centered on peak summit at the promoter (Transcriptional start site [TSS] ± 1kb) and enhancer (non-promoter) regions in GIST-T1 and GIST48 GIST cells (red) and LNCaP and MDA-PCa2b ETV1-translocated prostate cancer cells (magenta). Promoter and Enhancer sites were each clustered into 3 clusters (C1, C2, C3) using K-means. Right panel: De novo motif analysis of shared and distinct ETV1 binding sites in the promoter and enhancer regions. Top 2 most enriched motifs by significance are shown as motif sequence logo, percentage of peaks with the motif, and significance value, corresponding to different genomic regions. B, Representative ETV1 ChIP-seq profiles at DUSP6 (C3-shared enhancer), KLK3 (C2-prostate-specific enhancer) and GPR20 (C1-GIST-specific enhancer) gene loci in GIST and prostate cancer cells. C-E, Tukey plots of gene expression of ETV1 (C), FOXA1 (D), and FOXF1 (E) in different cancer types (Red: GIST; Magenta: Prostate cancer) in the Gene Expression across Normal and Tumor tissue (GENT) publically available pan-cancer dataset. P value is from two-tailed unpaired t-test of GIST vs all other tumors. F, Representative immunoblots of FOXF1 and ACTIN control in human GIST (GIST-T1, GIST48, GIST882) and melanoma (OMIM1.3, A375, A2058) cell lines. G, Representative IHC images of FOXF1 in FOXF1-positive (FOXF1 Pos, top panels) GIST and FOXF1-negative (FOXF1 Neg, bottom panels) sarcoma clinical samples. H, Distribution of FOXF1 IHC in tissue microarray of GIST and other sarcoma subtypes, Myxofibrosarcoma, Myxoid Liposarcoma, Synovial Sarcoma. P value is from Fisher’s exact test.
