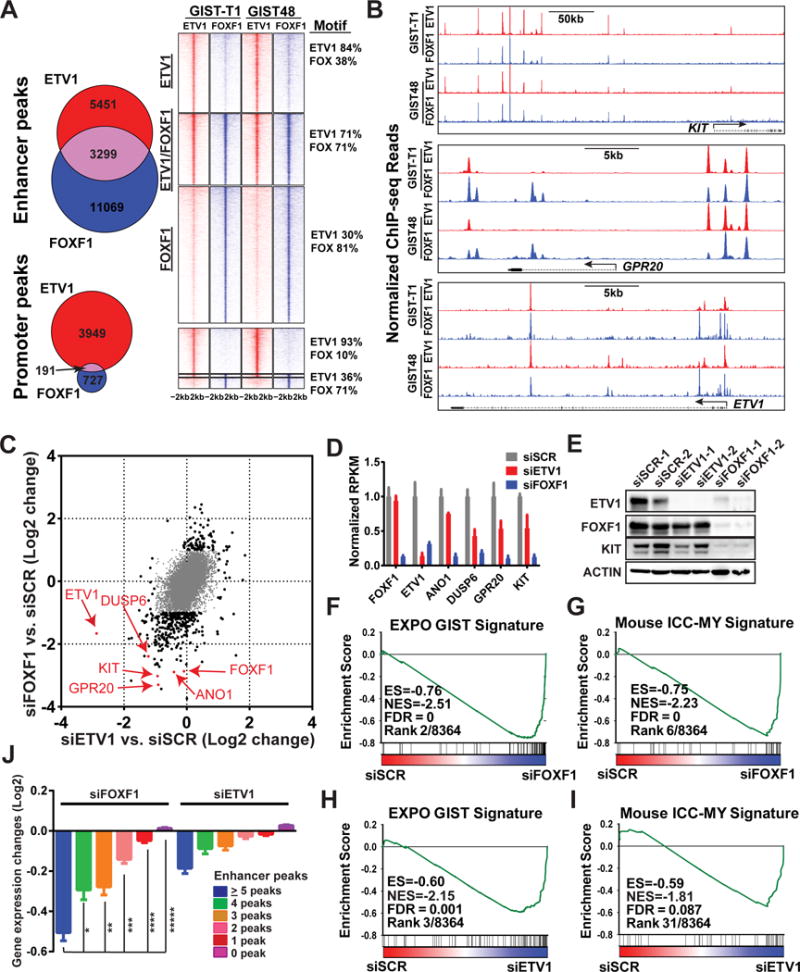
Figure 2. FOXF1 is a master-regulator that directly regulates KIT, ETV1 and the GIST-lineage specific transcriptome through enhancer binding.

A, Venn Diagram and density plots of FOXF1 (blue) and ETV1 (red) global binding sites by ChIP-seq in human GIST-T1 and GIST48 cells. Promoter: TSS±1kb, Enhancer: non-promoter. B, Representative FOXF1 and ETV1 ChIP-seq profiles in GIST cells at KIT, GPR20 and ETV1 loci. C, Scatter plot of gene expression changes by siRNA-mediated downregulation of FOXF1 (y-axis) and ETV1 (x-axis) compared to scrambled controls in GIST48 cells. Genes with ≥ 2-fold (Log2=1) change by either perturbation are marked in black dots, < 2-fold change in gray dots. D, Bar graph of gene expression changes by siRNA-mediated downregulation of FOXF1 and ETV1 compared to scrambled controls in GIST48 cells. N=2 distinct siRNA. Mean ± SD. E, Immunoblots of ETV1, FOXF1, KIT and ACTIN control with siRNA-mediated downregulation of FOXF1 and ETV1 in GIST48 cells. F-I, GSEA of transcriptome changes in GIST48 as a result of siRNA-mediated downregulation of FOXF1 (siFOXF1) (F-G) or ETV1 (siETV1) (H-I) compared to scramble controls (siSCR), demonstrating that the EXPO GIST Signature and Mouse ICC-MY Signature are among the most negatively enriched gene set signatures. ES: Enrichment Score; NES: Normalized Enrichment Score; FDR: False Discovery Rate. Rank: by FDR and ES amongst 8,364 gene sets. J, Mean expression change of all genes grouped by total number of ETV1 or FOXF1 enhancer peaks, induced by si-mediated downregulation of FOXF1 (left) and ETV1 (right). Error bars: Mean ± SEM. P value is from two-tailed unpaired t-test. *: P=0.0012; **-*****: P<0.0001.
