
Figure 4. FOXF1 modulates chromatin accessibility in GIST.
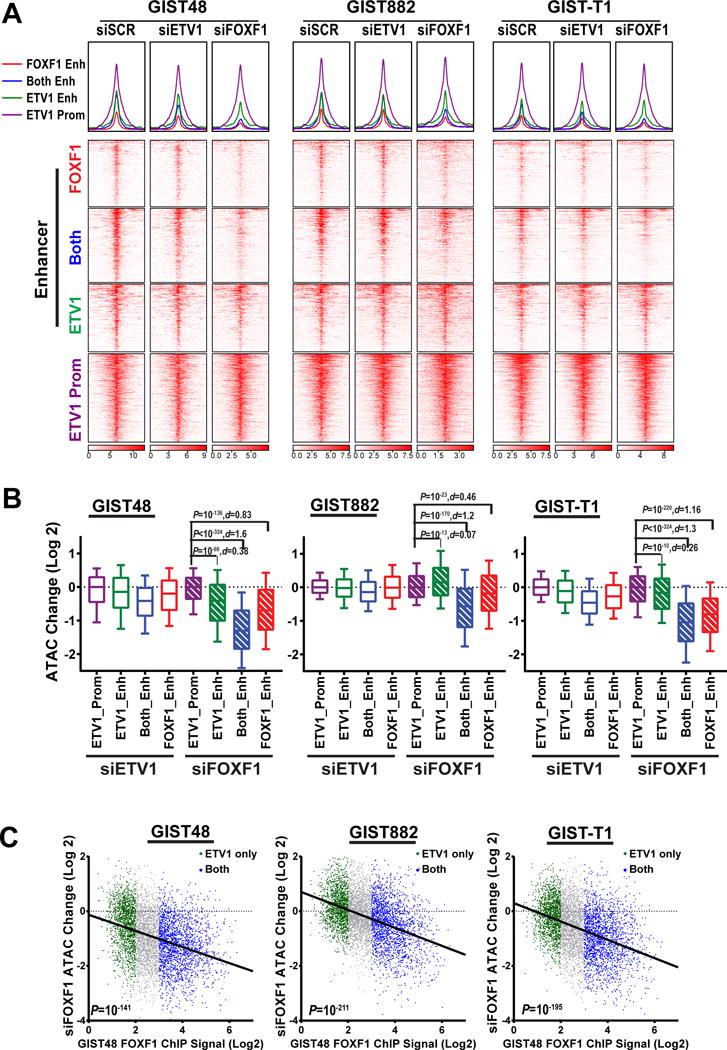
A, ATAC-seq profile (top) and heatmap (bottom) around ETV1 or FOXF1 peak center at enhancers (FOXF1 only: red, FOXF1/ETV1-shared [both]: blue and ETV1-only: green) and at ETV1-bound promoters (purple) with siRNA mediated downregulation of ETV1, FOXF1, or scramble (SCR) controls in GIST48, GIST882 and GIST-T1 cells. B, Box and whiskers plot showing change of ATAC-seq (Log 2) signal by siRNA-mediated downregulation of ETV1 or FOXF1 in GIST48, GIST882 and GIST-T1 cells. Box 75%, whiskers 90%. P: Mann-Whitney test d: Cohen size-effect. C, Scatter plots of ATAC-seq signal change (Log 2) correlated with FOXF1 ChIP-seq signal (Log 2) by siRNA-mediated downregulation of ETV1 or FOXF1 in GIST48, GIST882 and GIST-T1 cells. ETV1-only is marked green, and blue for ETV1 and FOXF1 shared binding sites. P: Fisher exact test.