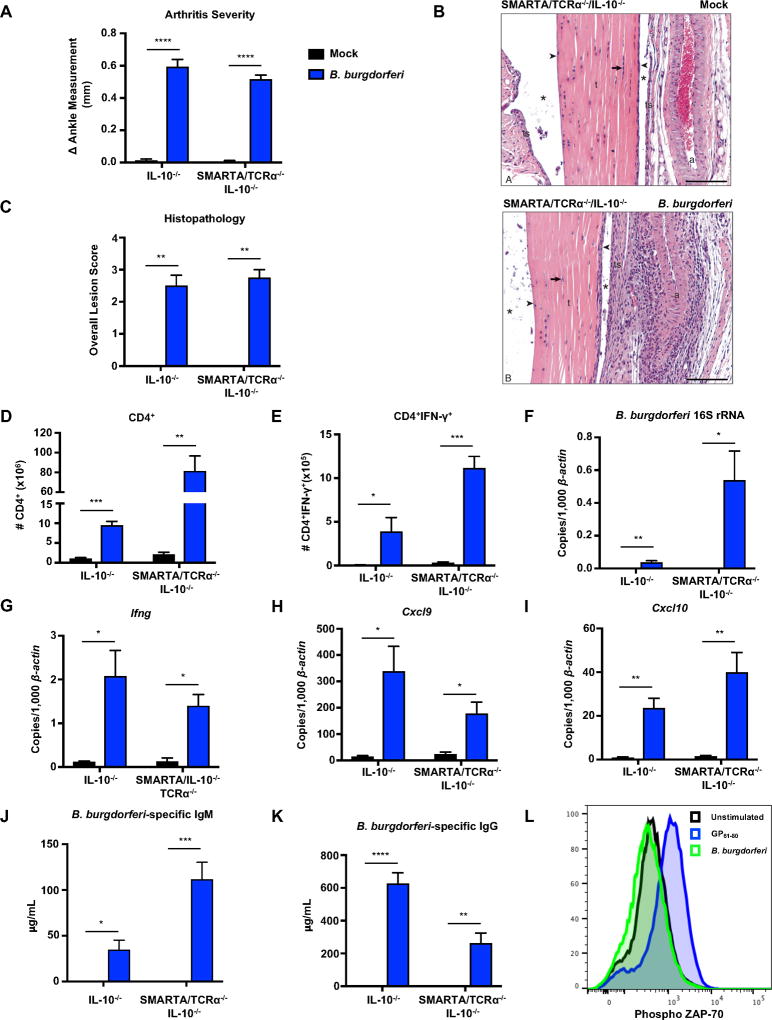
Figure 4. B. burgdorferi infection results in antigen-independent expansion and activation of TCR transgenic CD4+ T cells.
IL-10−/− and CD4+ TCR transgenic SMARTA/TCRα−/−/IL-10−/− mice were infected with B. burgdorferi for 4 weeks. (A) Measurements of rear ankles of mice were taken before infection and 4 weeks post-infection, and change in ankle measurement is shown. (B) Representative images of H&E-stained tibiotarsal joints from mock-infected (control) and 4 week-infected SMARTA/TCRα−/−/IL-10−/− mice used for histopathology scoring t= tendon, * = tendon space, ts= tendon sheath, arrow = tenocytes, arrowhead = synoviocytes, a = arteriole. scale bar = 100 µm. (C) The most swollen ankle was subjected to blinded histopathologic evaluation in a blind fashion. Scores 0–5, with 5 being most severe, were assigned to each sample. (D) The total number of CD4+ T cells were quantified from the popliteal and inguinal lymph nodes. (E) Lymph node cells were stimulated with PMA/Ionomycin in presence of Brefeldin A, and the number of CD4+IFN-γ+ T cells were quantified using flow cytometry. (F–I) Quantification of B. burgdorferi-specific 16S rRNA, Ifng, Cxcl9, and Cxcl10 was normalized to 1,000 β-actin in the joint using qRT-PCR. (J–K) Serum was obtained from mice two weeks post-infection and assessed for B. burgdorferi-specific IgM (J) and B. burgdorferi-specific IgG (K) using sonicated B. burgdorferi bound to ELISA plates (Methods). (L) Unfractionated naive SMARTA/TCRα−/−/IL-10−/− splenocytes were isolated and stimulated in the presence of B. burgdorferi (10µg/mL) or GP61–80 (1µM) for 3 hours. SMARTA CD4+ T cells were analyzed by flow cytometry for phosphorylated ZAP-70. Error bars indicate the SEM (n≥8 per group) Significant differences between mock and B. burgdorferi infected groups for each genotype were determined by Student’s t-test, with Mann-Whitney U test used for categorically accessed lesion scores (C) (*p<0.05, **p<0.01, ***p<0.001 ****p<0.0001). Data are representative of two independent experiments.

