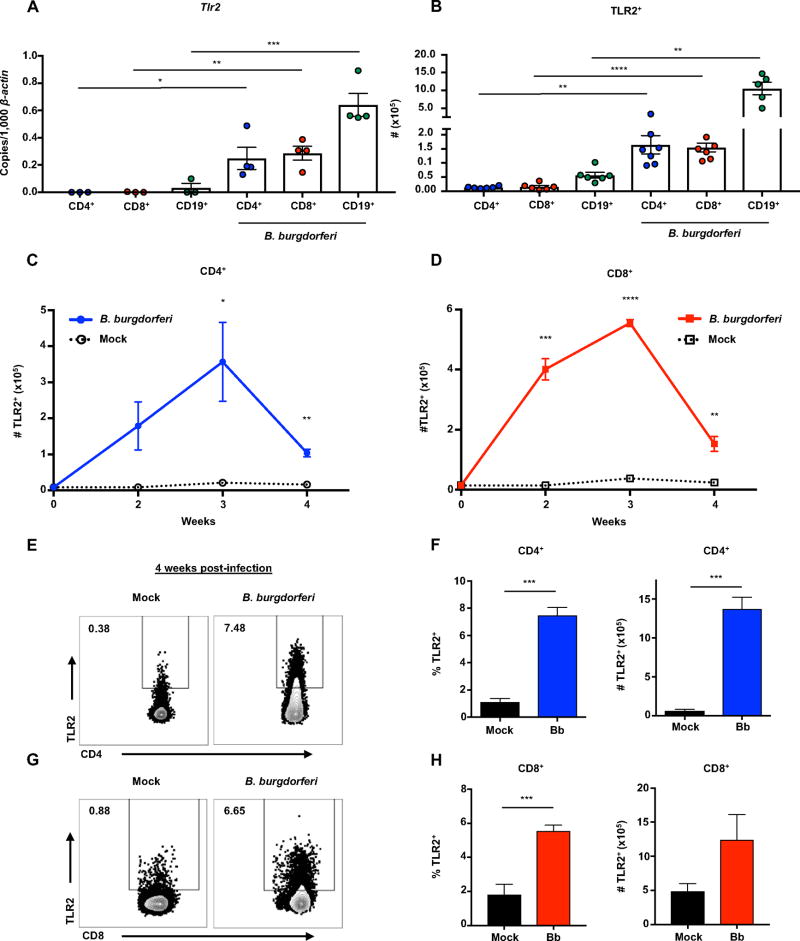
Figure 6. T cells display increased transcription and expression of TLR2 following B. burgdorferi infection.
Mice were infected with B. burgdorferi, after which popliteal and inguinal lymph nodes were collected for analysis of T cells and TLR2 expression. (A) CD3+CD4+, CD3+CD8+, and CD19+ cells were sorted from popliteal and inguinal lymph nodes of IL-10−/− mice using FACS sorting (BD FACSAria) 2 weeks post-infection. Tlr2 transcripts were measured in each cell population by qRT-PCR and normalized to 1,000 β-actin. (B) Quantification of the total number of CD3+CD4+TLR2+ and CD3+CD8+TLR2+ cells from IL-10−/− were determined by flow cytometry 4 weeks post-infection. (C and D) IL-10−/− mice were sacrificed at 1 week time intervals and analyzed by flow cytometry for TLR2 expression on CD3+CD4+ T cells (C) and CD3+CD8+ T cells (D). (E–F) SMARTA/TCRα−/−/IL-10−/− mice were infected with B. burgdorferi for 4 weeks, after which popliteal and inguinal lymph nodes were collected for analysis of T cells and TLR2 expression. (E) Numbers in upper left corner of flow plots are %TLR2+ cells. (F) The frequency and total number of CD3+CD4+TLR2+ cells were determined by flow cytometry. (G–H) OT-I/Rag2−/−/IL-10−/− mice were infected with B. burgdorferi for 4 weeks, after which popliteal and inguinal lymph nodes were collected for analysis of T cells and TLR2 expression. (G) Numbers in upper left corner of flow plots are %TLR2+ cells. (H) Quantification of the frequency and total number of CD3+CD8+TLR2+ cells were determined by flow cytometry. Error bars indicate the SEM (n≥3 per group). Significant differences between infected and uninfected groups by Student’s t-test are indicated (*p<0.05, **p<0.01, ***p<0.001 ****p<0.0001). Data are representative of two independent experiments.

