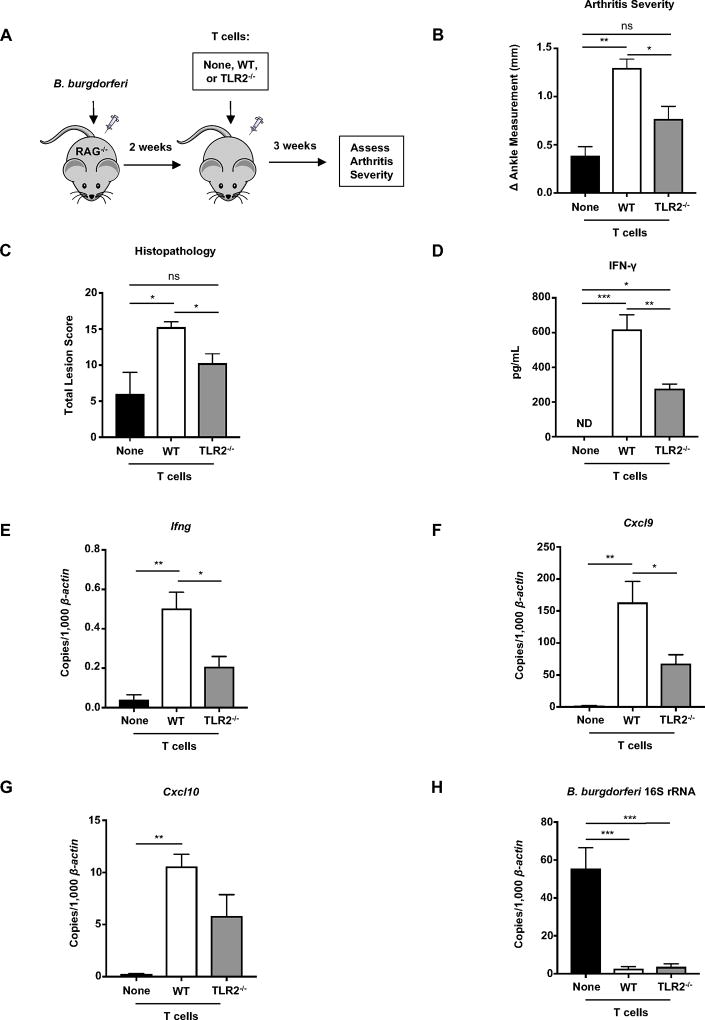
Figure 7. TLR2 expression on T cells enhances IFN-γ production and Lyme arthritis.
(A) C57BL/6 Rag1−/− mice were infected with B. burgdorferi 2 weeks before an intravenous injection of 6.5 × 10⁶ T cells isolated from the popliteal and inguinal lymph nodes and spleens of naïve healthy C57BL/6 WT or TLR2−/− mice. Infected Rag1−/− mice that did not receive lymphocytes served as controls. (B) Arthritis severity was determined 5 weeks post infection (3 weeks after injection of T cells). (C) The most swollen ankle was assessed by histopathologic evaluation in a blind fashion. Scores 0–5, with 5 being most severe, were assigned to each sample. The total score is shown is based on polymorphic (neutrophils) and/or mononuclear cell (lymphocyte/macrophage) infiltrates, tendon sheath thickness, and reactive/reparative responses affecting the joint. (D) Quantification of IFN-γ in the serum was determined using ELISA. (E–H) Quantification of Ifng, Cxcl9, Cxcl10, and B. burgdorferi-specific 16S rRNA was normalized to 1,000 β-actin in the joint using qRT-PCR. Error bars indicate the SEM (n = 4 per group). Statistically significant differences between groups by ANOVA followed by Bonferroni’s post-hoc test is indicated (*p<0.05, **p<0.01, ***p<0.001). For lesion scoring, Mann-Whitney U test was used to determine whether there was statistically significant difference with groups, with p values indicated.

