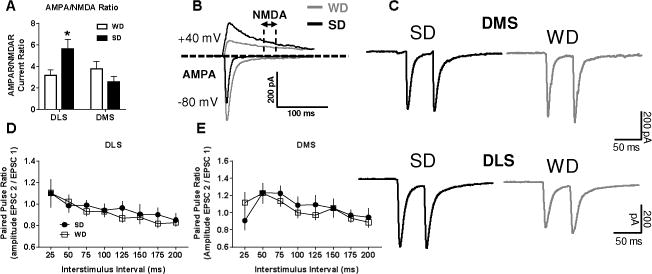
Figure 3. WD consumption increases the AMPAR/NMDAR specifically in the DLS, with no effect on the probability of presynaptic glutamate release.

Voltage clamp recordings revealed A) elevated AMPAR to NMDAR current ratio within the DLS of WD relative to SD mice. B) Representative AMPAR and NMDAR traces from WD and SD cells. C) Representative PPR traces for 50 ms interstimulus interval in both dorsal striatal subregions. Paired pulse ratio analysis of presynaptic glutamate release probability in D) DLS and E) DMS also revealed no group differences. n = 5-10 cells per diet × subregion; 2-3 mice per condition. p* < 0.05, p** < 0.01 vs. SD.
