
Figure 4. WD consumption prolongs glutamategic sEPSCs specifically in the DLS.
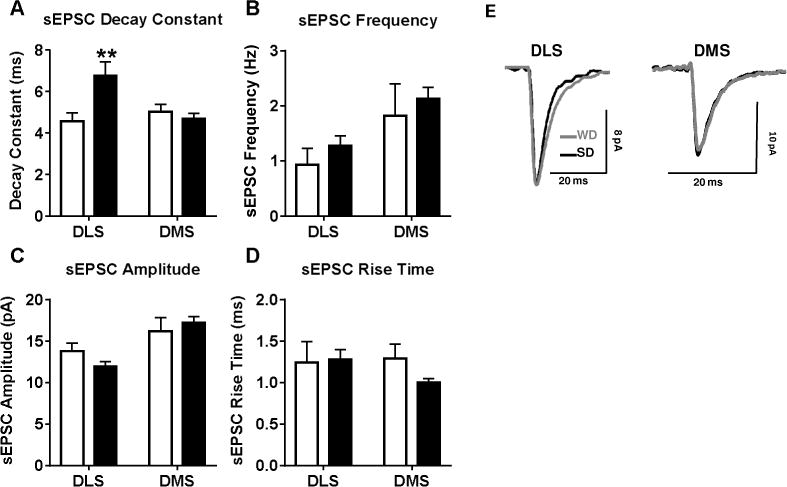
A) Recordings of spontaneous EPSCs (sEPSCs) demonstrated a prolonged decay period for sEPSCs within the DLS. Measures of B) sEPSC frequency, C) amplitude, D) and rise time revealed no diet-induced differences. E) Representative sEPSC traces from WD and SD cells. n = 5-10 cells per diet × subregion; 2-3 mice per condition. p* < 0.05, p** < 0.01 vs. SD.