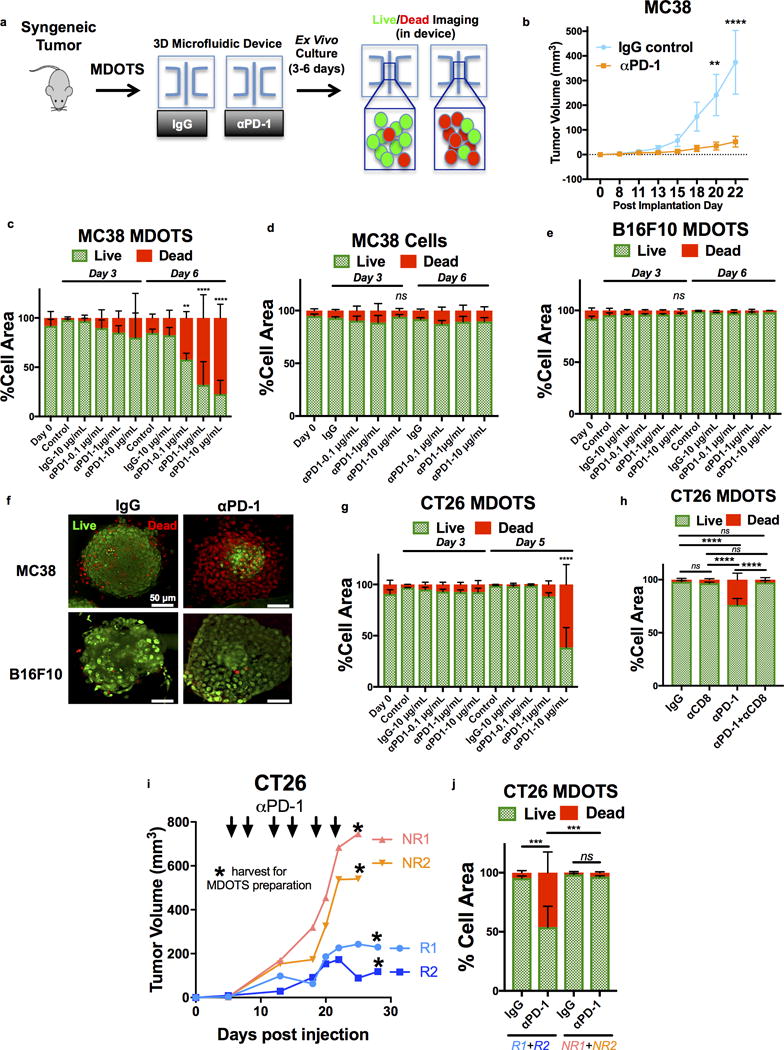
Figure 2. Ex vivo profiling of PD-1 blockade using MDOTS.

a, Schematic of MDOTS Live/Dead Imaging workflow. b, MC38 implanted tumor volume following isotype control IgG (n=10) or rat-anti-mouse anti-PD-1 antibody (n=10) treatment (mean ± s.e.m., 2-way ANOVA, Sidak’s multiple comparison test, **p<.01, ****p<0.0001). c, Live (AO = green)/dead (PI = red) quantification of MC38 MDOTS Day 0 (immediately after loading), Day 3, and Day 6 following IgG control or indicated anti-PD-1 antibody doses (n=4, biological replicates, 2-way ANOVA with Dunnett’s with multiple comparisons test, **p<.01, ****p<0.0001). d, Live/dead analysis of MC38 spheroids lacking immune cells ± anti-PD1 (n=4, biological replicates). e, Live/dead analysis of B16F10 MDOTS ± anti-PD1 (n=3, biological replicates). f, Deconvolution fluorescence microscopy of MC38 and B16F10 MDOTS Day 6 ± anti-PD1 (representative images shown). g, Live/dead analysis of CT26 MDOTS ± anti-PD1 (n=3, biological replicates, 2-way ANOVA with Dunnett’s with multiple comparisons test; ****p<0.0001). h, Live/dead analysis of CT26 MDOTS performed on Day 6 following treatment with isotype IgG control (10 μg/mL) or anti-PD-1 (10 μg/mL) ± anti-CD8 (10 μg/mL) (n=6, biological replicates; 2-way ANOVA with Tukey’s multiple comparisons test; ****p<.0001, ns = not significant). i, CT26 tumor volumes for responder (R1+R2) and non-responder (NR1+NR2) Balb/c mice treated with anti-PD-1 (10mg/kg twice weekly × 6 doses, starting at Day 5) with time of tumor harvest for MDOTS preparation indicated (*). j, Live/dead analysis (Day 6) of CT26 MDOTS from responder and non-responder mice following ex vivo treatment with isotype IgG control (10 μg/mL) or anti-PD-1 (10 μg/mL) (n=3, biological replicates; 2-way ANOVA with Tukey’s multiple comparisons test; ***p<.001, ns = not significant).
