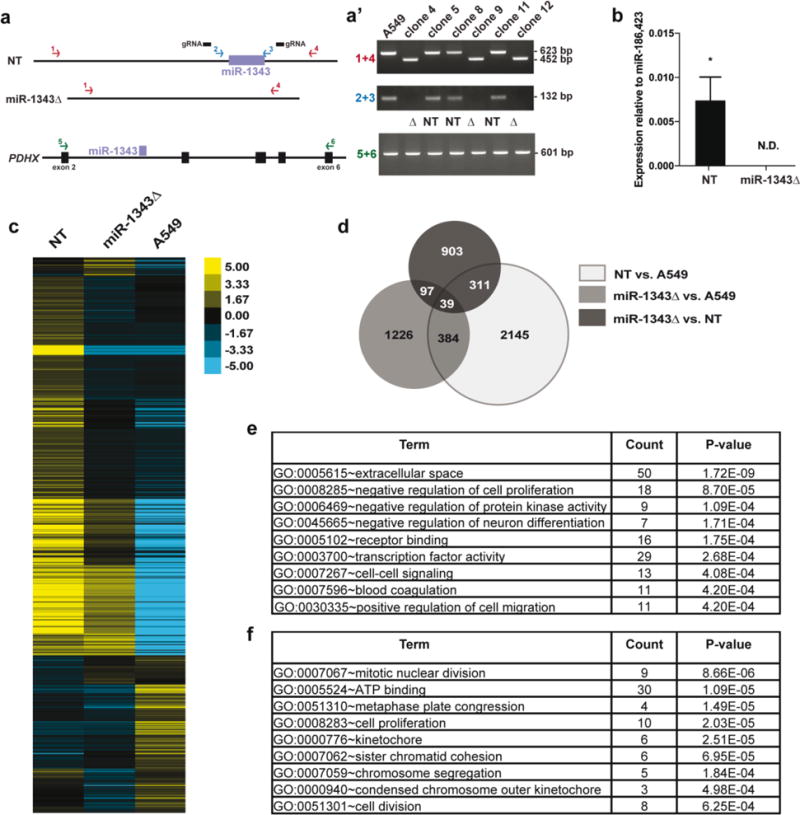
Fig. 1. RNA-seq identifies pathways altered by miR-1343 deletion.

a. Schematic showing PCR assays used to test for miR-1343 deletion and confirm PDHX integrity following CRISPR/Cas9 genome editing. Two primer sets located external (1 + 4, in red) and internal (2 + 3, in blue) to the guide RNAs (gRNAs, black bars) were used to identify non-targeted (NT) and miR-1343 deletion (miR-1343Δ) clones. PCR primers spanning the deletion (5+6, in green) were used to confirm PDHX mRNA integrity. a’. Clones 4, 9, and 12 show a product at 452 bp (and no wild type product at 623 bp) with the external primers, and lack a product with the internal primers, indicating homozygous deletion. RT-PCR reactions show normal splicing of PDHX exons 2 – 6 in all clones (figure not to scale). b. miR-1343 expression levels measured by TaqMan Advanced qRT-PCR assay in 3 NT clones and 3 miR-1343Δ clones. Values are normalized to the geometric mean of miR-186 and miR-423 values. N.D.=not detected, *p≤0.05 by unpaired Student’s t test. c. Heatmap illustrating the relative expression of differentially expressed genes (DEGs) in NT clones, miR-1343Δ clones, or non-clonal A549 cells. Each line represents a different gene. d. Venn diagram of DEGs identified by RNA-seq between NT clones and A549 cells (light grey), miR-1343Δ clones and A549 cells (medium grey), and miR-1343Δ clones and NT clones (dark grey). The overlapping regions represent the number of DEGs shared between groups. DEGs identified between NT clones and A549 cells were excluded from further analysis. e.,f. DAVID gene ontology analysis of down-regulated genes (e) and up-regulated genes (f) identified by RNA-seq following miR-1343 deletion.
