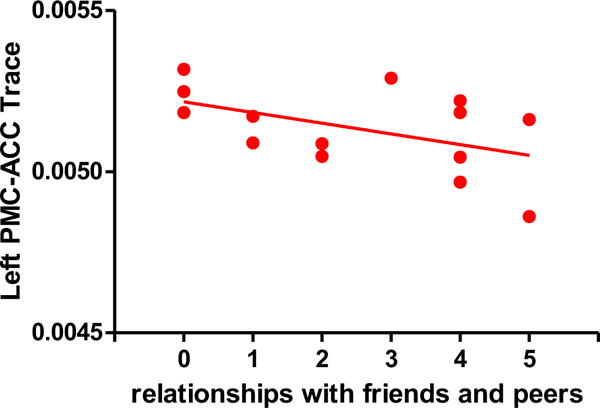
Figure 3-2.

Scatterplot illustrating the relationship between scores on the Relationships with Friends and Peers test (an item of the Anhedonia-Asociality subscale of the SANS) and Trace in the left PMC-ACC in first-episode schizophrenia. The solid line represents the best linear fit for the data. (rho=−.54, p =0.049)
