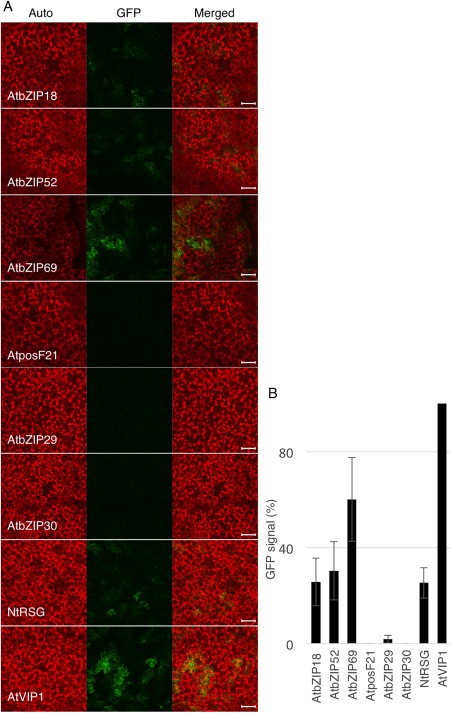
Figure 4.

Induction of VIP1 response element (VRE)‐controlled green fluorescent protein (GFP) expression by AtVIP1 and its homologues. (A) Confocal microscopy analysis of GFP expression in Nicotiana benthamiana leaves 3 days after co‐infiltration with two Agrobacterium strains carrying the VRE1–35Smin‐GFP reporter construct and a construct expressing AtVIP1 or its indicated homologues. The GFP signal is in green; plastid autofluorescence is in red. Images are single confocal sections, and are representative of images obtained in three infiltrations performed on three different leaves, with two images recorded per infiltration. Scale bars, 100 µm. (B) Quantification of the VRE1‐GFP reporter expression shown in (A). The GFP signal was quantified using LSM Pascal software (Zeiss, Oberkochen, Germany) by measuring the total GFP fluorescence in one field inside the infiltration area with a low magnification objective (10×); all images used for fluorescence measurement were taken with the same settings. The basal signal measured in an area infiltrated with VRE1‐GFP alone was subtracted from the values measured for each experimental condition, and the signal obtained with AtVIP1 was set as 100%. Error bars represent the standard error of the mean (SEM) of n = 3 independent biological replicates (leaves).
