
Figure 2.
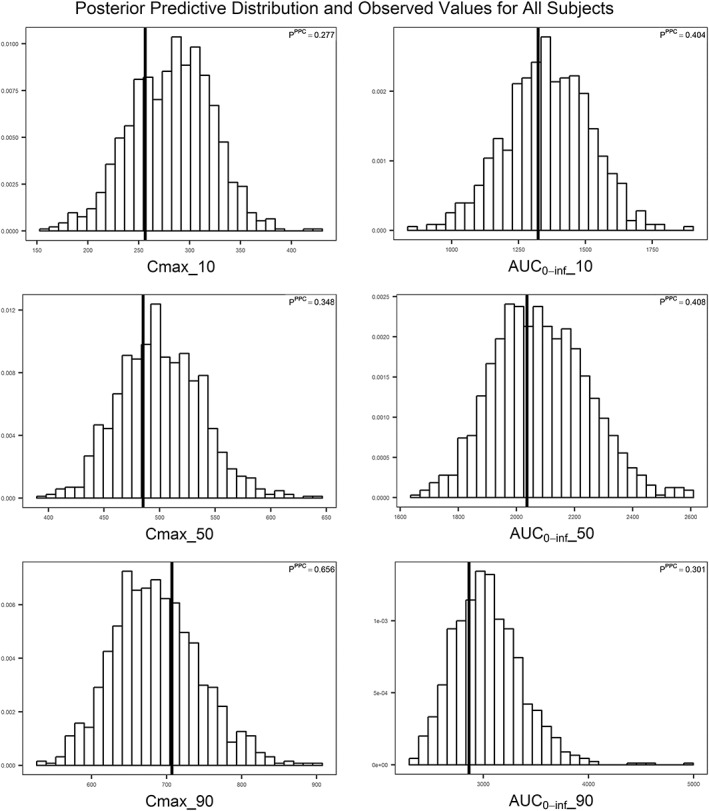
Model evaluation of exendin‐(9‐39) population pharmacokinetic model using the posterior predictive check for all subjects. Posterior predictive distributions of test statistics from 1000 simulated data sets are presented. The vertical line on each histogram represents the observed value of the test statistic. C max_10, C max_50, and C max_90 represent C max values at 10th, 50th (median), and 90th percentile, respectively. AUC0‐inf_10, AUC0‐inf_50, and AUC0‐inf_90 represent AUC0‐inf values at 10th, 50th (median), and 90th percentile, respectively