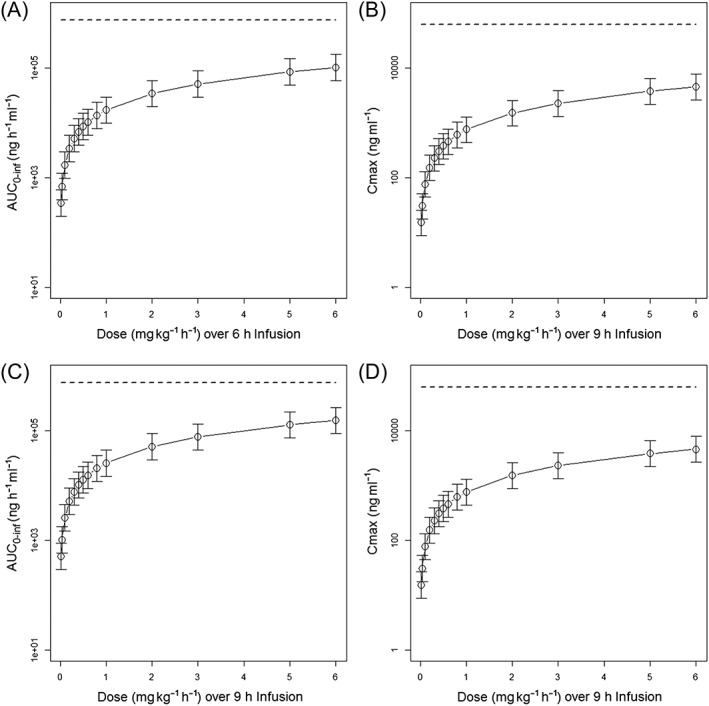
Figure 3.

Simulated exendin‐(9‐39) AUC0–inf and C max for subjects from the Neonate Study for 0.02, 0.04, 0.1, 0.2, 0.3, 0.4, 0.5, 0.6, 0.8, 1, 2, 3, 5, 6 mg kg−1 h−1 infused over 6 (A and B) and 9 (C and D) hours. The dashed line represents the exposure levels at no observed adverse effect level in rats. Open circles represent the median value, and error bar represents the 95% percentile. AUC0‐inf = area under the plasma concentration–time curve from zero to infinity, C max = maximum plasma concentration
