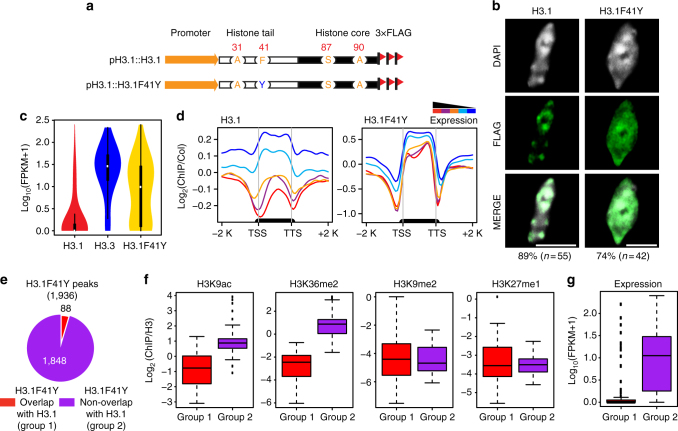
Fig. 3.
Phe41 plays an important role in H3.1 distribution. a Schematic diagram of wild-type H3.1 and H3.1F41Y FLAG-tagged constructs. b Localization of wild-type H3.1 and H3.1F41Y protein in nuclei (bar = 5 μm). The n represents the total number of examined nuclei. The percentage describes the ratio of the nuclei showing the H3 distribution pattern out of total examined nuclei. DAPI indicates the DAPI staining of the nucleus. c Violin plot of the expression levels of genes associated with H3.1, H3.3, and H3.1F41Y ChIP-seq peaks. The y-axis represents the log10 value of FPKM +1. RNA-seq data were from 3-week-old seedlings. d Metagene plots of wild-type H3.1 and H3.1F41Y ChIP-seq reads over five groups of genes divided based on their expression levels. The black bar in the x-axis represents genes. TSS transcription start sites; TTS transcription terminal sites; −2 K and +2 K represent 2 kb upstream of TSS and 2 kb downstream of TTS, respectively. The y-axis represents the log2 value of H3.1 and H3.1F41Y ChIP-seq reads normalized to those of Col-0. e Pie chart showing the H3.1F41Y ChIP-seq peaks that overlapped with H3.1 peaks (defined as Group 1) or not overlapped with H3.1 peaks (H3.1F41Y unique peaks, defined as Group 2). f Boxplots of histone modification levels over peak-associated genes from the two groups defined in e. The y-axis represents the ChIP-seq reads normalized to those of H3. Histone modification ChIP-seq data were from 2-week-old aerial tissues. g Boxplot of expression levels of genes associated with the peaks from the two groups defined in e. FPKM, fragments per kilobase of transcript per million mapped reads

