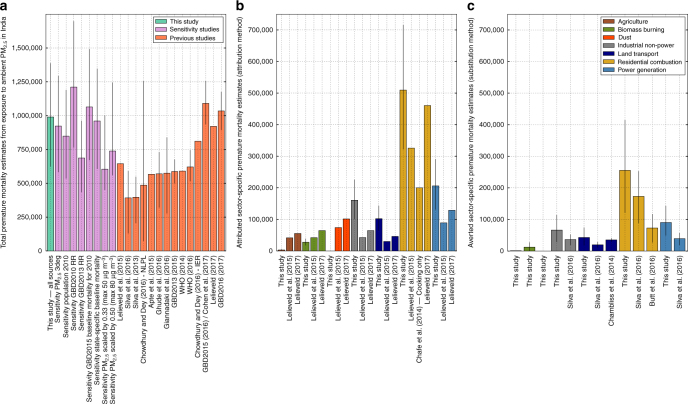
Fig. 4.
Comparison of annual premature mortality estimates for India due to exposure to ambient PM2.5. a Total annual premature mortality from exposure to ambient PM2.5 from all emission sources. This study (green) and sensitivity studies (purple) comparing varying model spatial resolution, population year, exposure–response function, baseline mortality rates and PM2.5 concentrations are compared with previous studies (orange). b Attributed sector-specific estimates from the attribution method from this study compared to previous studies. c Averted sector-specific estimates from the substitution method from this study compared to previous studies. Error bars for this study and sensitivity analyses represent 95% uncertainty intervals (95UI) calculated from combining fractional errors in quadrature (see Methods). Error bars for previous studies given at the 95% uncertainty level where provided

