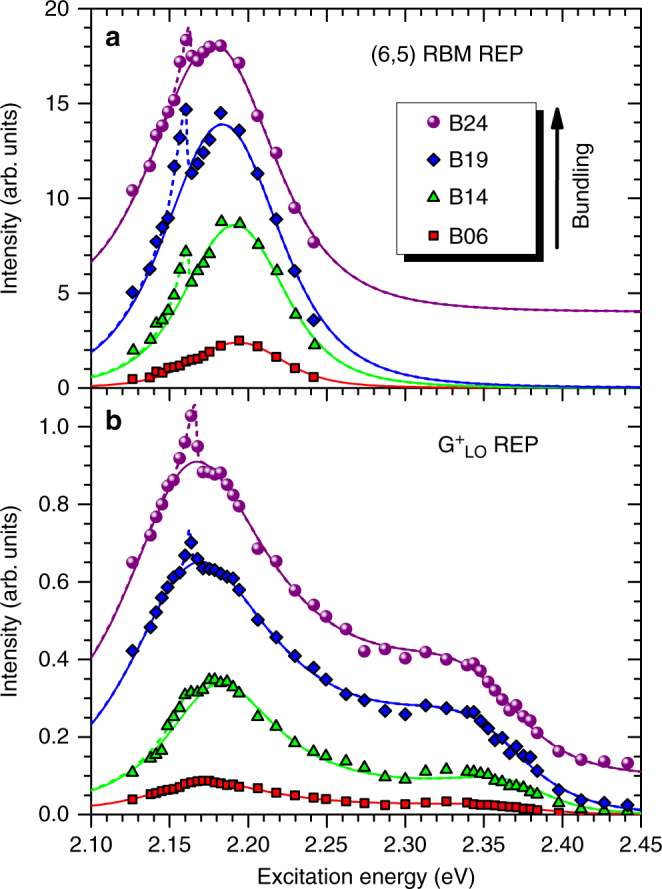
Fig. 2.

Bundle-dependent appearance of sharp anomalous resonance peak in Raman excitation profiles of (6,5)-enriched SWCNTs. REPs of the a RBM and b mode with increasing bundle size for SWCNT fractions labeled B06 to B24. Data shown as symbols, fits to a Lorentzian model (as described in text) shown as lines. A sharp additional feature at ~2.16 eV appears for bundled samples and increases with bundle size. In fitting the REPs to Eq. (1), Eph was fixed at the experimentally measured phonon frequencies. A dashed line is added over the anomalous peak (AP) feature as a guide to the eye. Curves for B24 offset vertically for clarity
