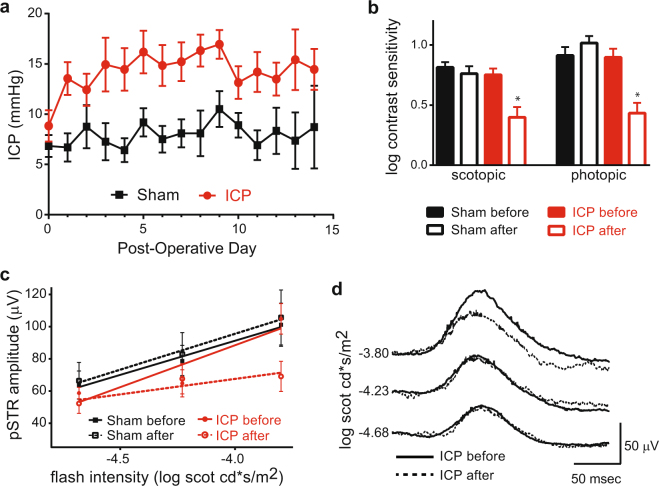
Figure 1.
ICP elevation is stable and causes reduced behavioral contrast sensitivity and RGC electrical responses. (a) ICP readings for Sham (black) and ICP (red) animals plotted for the entire 2-week experiment. ICP was elevated on Post-Operative Day (POD) 1 and maintained at an increased level in the ICP group. ICP elevated animals had a significantly higher ICP from POD 1–14 when compared to POD 1–14 for the Sham group (ANOVA; p < 0.0001). N = 19 animals for Sham and N = 17 animals for ICP. Error bar = 1 SEM. (b) Log contrast sensitivity was measured initially on the day after probe implantation, just prior to experimental ICP elevation (Sham before and ICP before) and again after 2 weeks (Sham after and ICP after) under both scotopic (left) and photopic (right) conditions. A significant decrease in contrast sensitivity was observed after 2 weeks of ICP elevation under both scotopic and photopic conditions (asterisks; t test, p < 0.0001 for each). N = 12 eyes for Sham and N = 16 eyes for ICP. Error bar = 1 SEM. (c) Mean electroretinogram (ERG) pSTR amplitude plotted against the intensity of scotopic flash stimuli. The best-fit linear regression lines of pSTR amplitude growth are indicated for each condition (red and black solid and dotted lines). The magnitude of the linear regression slope of pSTR growth at the end of the 2-week experiment is reduced only in the setting of increased ICP (t test comparing ICP after to ICP before, p = 0.01; t test comparing Sham after to Sham before, p = 0.33). N = 26 eyes for Sham and N = 12 eyes for ICP. Error bar = 1 SEM. (d) Plot of average pSTR curves before (solid line) and after (dotted line) 2 weeks of ICP elevation (N = 12 eyes). There is a decreased pSTR amplitude with flash stimulus at the brightest tested scotopic intensity.

