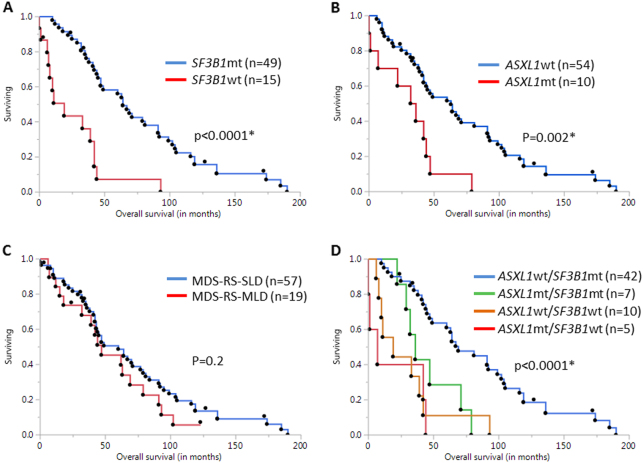
Fig. 1. Kaplan-Meir survival analysis for MDS-RS patients based on somatic mutational analysis.
a shows Kaplan-Meir survival curves for SF3B1 mutated (mt) and wild-type (wt) patients. Log-rank test was used to assess difference between groups. Median OS is significantly higher in the SF3B1 mt patients (64 versus 19 months, p < 0.0001*). b shows a similar analysis, depending on ASXL1 mutational status. Median OS in ASXL1 wt patients is much higher than ASXL1 mt patients (64 versus 39 months, p = 0.002*). c shows Kaplan–Meir survival curves among the two sub-groups based on bone marrow morphology (MDS-RS-SLD and MDS-RS-MLD). No significant survival difference was found between the two groups (p = 0.2). d shows Kaplan-Meir survival curves for four sub-groups, based on presence or absence of both SF3B1 and ASXL1 mutations. Median OS was highest in ASXL1 wt/SF3B1 mt (n = 42, 69 months) sub-group (p < 0.0001*), followed by ASXL1 mt/SF3B1 mt (n = 7, 39 months), ASXL1 wt/SF3B1 wt (n = 10, 19 months) and ASXL1 mt/SF3B1 wt (n = 5, 7 months) sub-groups, respectively

