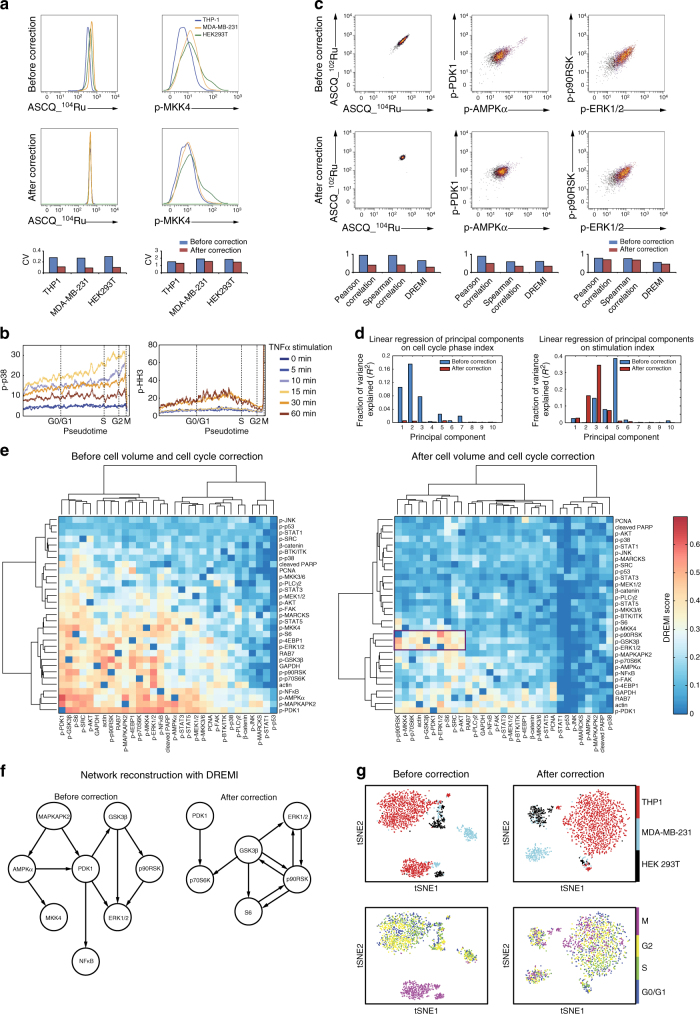
Fig. 2.
CellCycleTRACER corrects for cell-volume and cell-cycle heterogeneity enabling unbiased data visualization and downstream analysis. a Overlaid histograms reveal differential data observations before and after cell-volume correction. Bar charts show that cell-volume correction also reduces intra-sample variation as coefficients of variation of measured markers decrease. b Abundance of p-p38 (Thr180/Tyr182) and p-HH3 (Ser28) plotted on the cell-cycle pseudotime based on data from TNFα-stimulated THP-1 cells. Stimulation time points are indicated by different colors. c Biaxial plots show signaling relationships between measured markers before and after cell-volume and cell-cycle correction. Relationship strengths quantified by Pearson correlation, Spearman correlation, and DREMI are indicated in the corresponding barplots. d Principal component analysis of data originating from a mixed population of unstimulated (t = 0 min) and stimulated (t = 15 min) THP-1 cells. After computing the principal components of the data before and after cell-cycle correction, the variances explained by fitting a linear model of the principal components on the cell-cycle state index (left) and the stimulation state (right) were estimated, indicating removal of cell-cycle confounding effects. e Clustergrams of pairwise DREMI analyses of unstimulated THP-1 cells before and after cell-volume and cell-cycle corrections. After the removal of cell-volume and cell-cycle variability, DREMI scores of non-interactive pairs are reduced, and AKT and MAPK/ERK signaling pathways become apparent. f Network reconstruction using the top 10 DREMI scorers in unstimulated THP-1 cells before and after cell-volume and cell-cycle corrections. Network reconstructed after correction recapitulates key regulatory interactions in the AKT and MAPK/ERK pathways. g tSNE maps of THP-1, MDA-MB-231, and HEK293T cell lines before and after cell-volume and cell-cycle correction. Cell-cycle and cell-volume markers were not included in the tSNE analysis

