Figure 2.
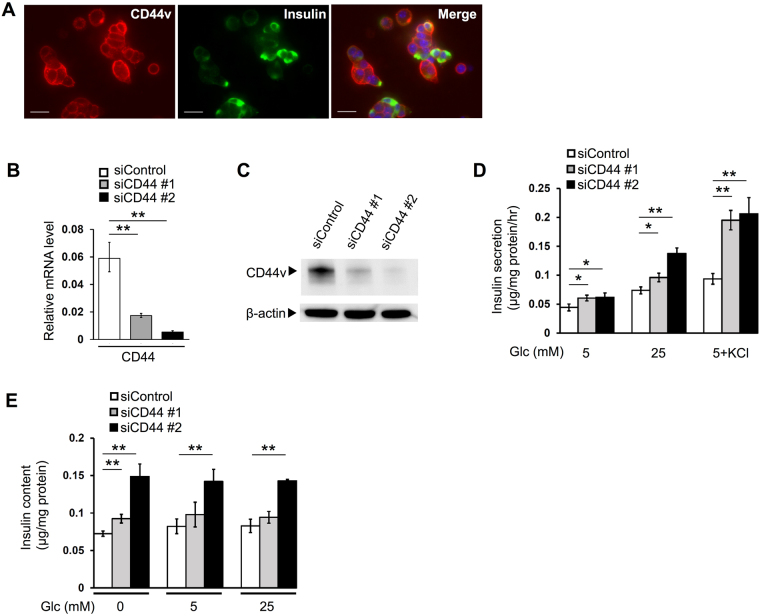
CD44 depletion increases insulin secretion and insulin content in Min6 cells. (A) Immunofluorescence staining for CD44v and insulin in Min6 cells. The fluorescence (blue) of nuclei counterstained with DAPI is shown in the merged image. Scale bars, 50 µm. (B) RT and real-time PCR analysis of CD44 gene transcripts in Min6 cells transfected with control or CD44 (#1 or #2) siRNAs. (C) Immunoblot analysis of CD44v and β-actin (loading control) in Min6 cells transfected as in (B). (D) Min6 cells transfected as in (B) were incubated for 1 h in the presence of 5 or 25 mM glucose or of 5 mM glucose (Glc) plus 30 mM KCl, after which the amount of insulin released into the incubation medium was determined with an ELISA. (E) The insulin content of Min6 cells transfected as in (B) was determined with an ELISA before and after incubation for 1 h in the presence of 5 or 25 mM glucose. All quantitative data are means ± s.d. for three independent experiments. *P < 0.05, **P < 0.01 (unpaired Student’s t test).

