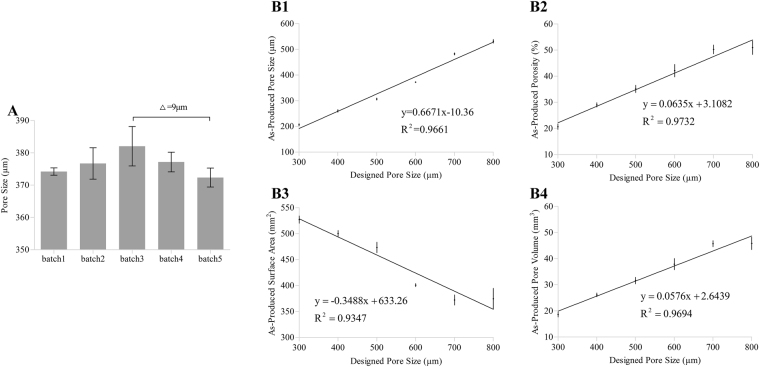
Figure 4.
Results of inter-batch variation and intra-batch correlation analysis. (A) The average PS for 5 batch experiments of printing po600 spread out over six months and determined using OCT image analysis. Δ is the measured maximal inter-batch variation. (B1–B4) Correlation between the designed PS and average values of (B1) PS, (B2) VP, (B3) SA, and (B4) PV obtained by OCT image analysis (intra-batch variation), which shows the corresponding correlation functions of six different predefined geometries (po300, po400, po500, po600, po700, and po800). Error bars represent the measured intra-batch variation.

