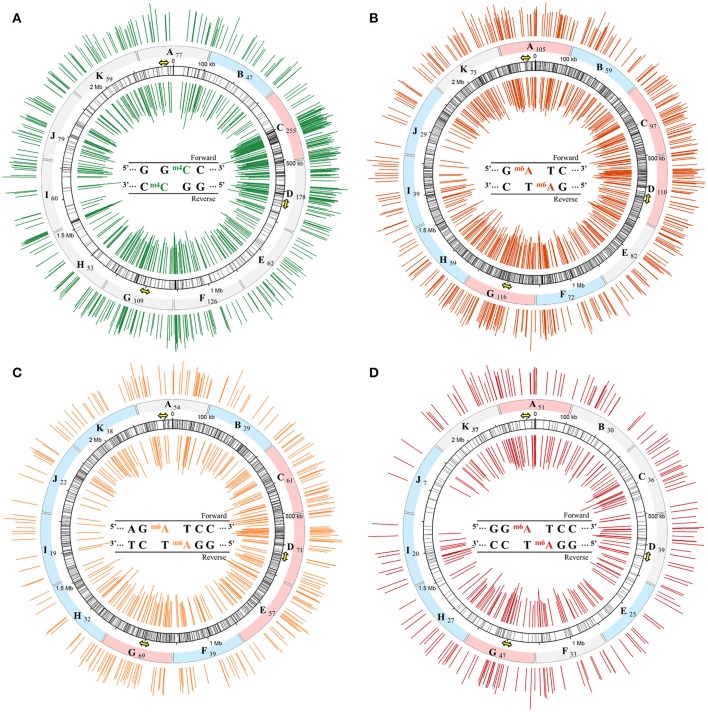
Figure 3.
Distribution of the m4C and m6A methylations associated with their corresponding recognition sequences along the genomic DNA of S. acidocaldarius. Positions of each motifs: 5′-GGCC- 3′ (A), 5′-GATC-3′ (B), 5′-AGATCC-3′ (C), and 5′-GGATCC-3′ (D) are reported on the entire double stranded genome represented by the numbered track (black circle). By base pairing, these motifs form specific recognition sequences symbolized by black lines. IPD ratio data corresponding only to m4C (A) and m6A (B–D) are reported on both strands over the genome with the inner and outer circle representing the reverse and forward DNA strands, respectively. The methylated base is colored in each specific recognition sequences in the center of each circle. Position of the three origins of replication are symbolized by the yellow arrows. The genome was divided into 11 sections from A to K and number of methylated motif counted in each portion is reported. Portions are filled in blue, red, or gray indicating whether they are hypo-, hypermethylated, or in the 95% confidence interval, respectively. Four plots were designed using the software Circos (Krzywinski et al., 2009).

