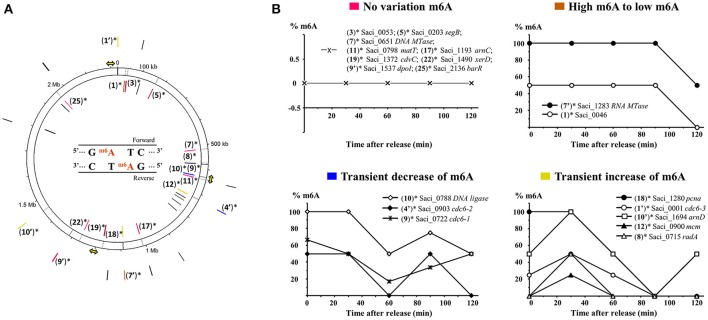
Figure 4.
Variations of the percentage of m6A in 37 selected genes during the cell cycle. Distribution of 37 genes along the chromosome of S. acidocaldarius represented by the numbered track (black circle) drawn on the Circos plot (A). Gene numbers introduced in Table 4 are used for localizing the corresponding gene along the genome. Genes containing, at least, one 5′-GATC-3′ recognition sequence in two identified contexts, 5′-AGATCC-3′ and 5′-GGATCC-3′, are marked by an asterisk and their recognition sequences are reported in the numbered track by a black line. Four patterns of m6A variations of genes containing 5′-GATC-3′ are identified and associated by a color code (A,B). The three replication origins are represented by yellow arrows.

