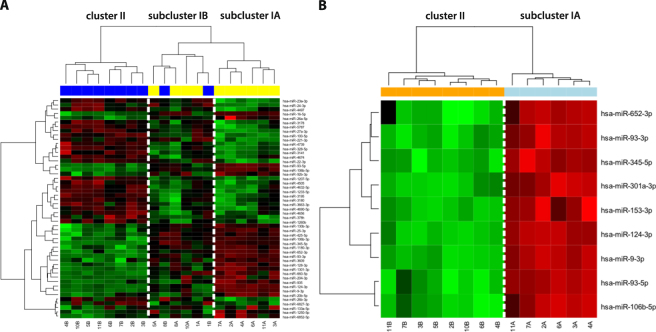
Figure 3.
Hierarchical clustergram discriminating paired primary GSC (yellow) and non-stem glioblastoma cell cultures (blue) propagated in serum-free and serum containing medium, respectively. (A) Based on 51 differentially (P < 0.001) expressed miRNAs, (B)Based on 9 miRNAs differentially (P < 0.0001) expressed in GSC and non-stem cell cultures contained in subclusters IA and II, respectively. A gradient of green and red colors is used in the heatmap (green color indicates lower expression whereas red color indicates higher expression of individual miRNAs in analyzed samples).

