Figure 5.

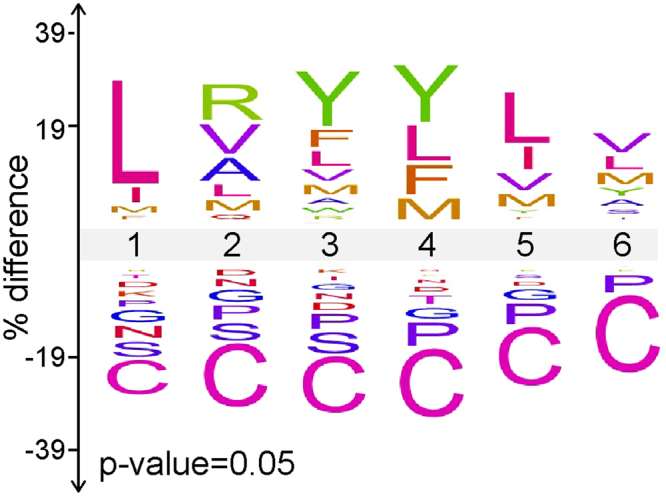
ADAMTS13 substrate recognition motif. The iceLogo plot representing the relative frequency of every amino acid in the cleaved (top) and uncleaved (bottom) peptide pools following ADAMTS13 selection of the VWF73(P3-P3′) library.

ADAMTS13 substrate recognition motif. The iceLogo plot representing the relative frequency of every amino acid in the cleaved (top) and uncleaved (bottom) peptide pools following ADAMTS13 selection of the VWF73(P3-P3′) library.