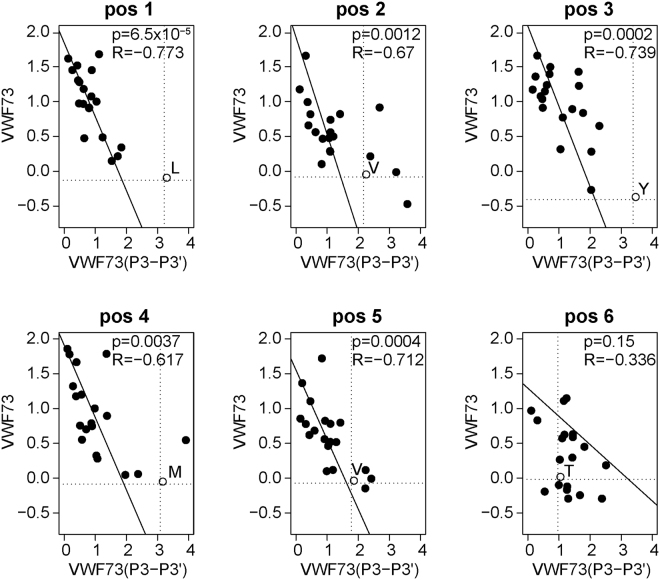
Figure 7.
Correlation between ADAMTS13 selection of VWF73 mutagenesis and VWF73(P3-P3′) libraries. ADAMTS13 selection of the VWF73(P3-P3′) library was compared to previously reported VWF73 mutagenesis data30, where substitutions tended to inhibit cleavage of wild type VWF73. Thus, the enrichment for each substitution within the P3-P3′ interval30 was correlated to the relative proportions of each amino acid in enriched compared to depleted peptides from the VWF73(P3-P3′) library selection. Each panel represents an amino acid position, and each data point represents an amino acid substitution. The wild type amino acid at each position is indicated at the intersection of the dashed lines. Values represented in each plot correspond to p-values calculated for each correlation (top) and the R value (bottom) for the linear regression (line).

