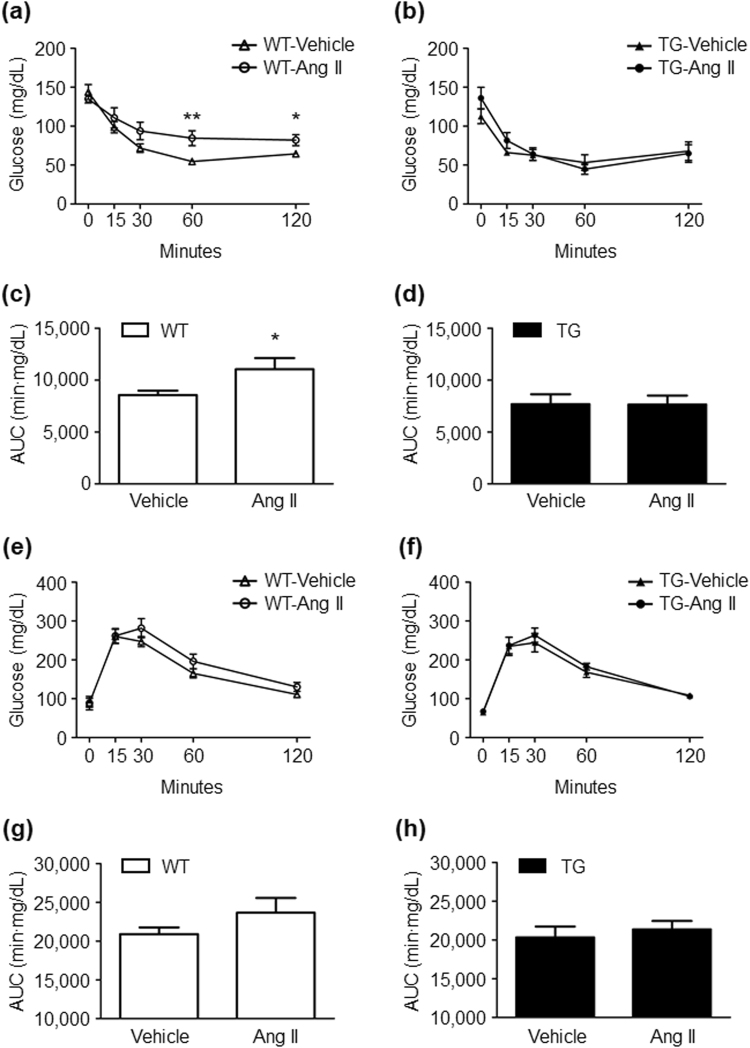
Figure 3.
Ang II infusion induces insulin resistance and tends to impair glucose tolerance only in WT mice. The insulin tolerance test in WT (a) and TG mice (b), and the glucose tolerance test in WT (e) and TG mice (f) after 2 weeks of vehicle or Ang II infusion. The AUCs of the insulin tolerance test in WT (c) and TG mice (d), and those of the glucose tolerance test in WT (g) and TG mice (h) after 2 weeks of vehicle or Ang II infusion. Values are expressed as mean ± SE (n = 7–10 in each group). *P < 0.05, **P < 0.01, vs vehicle. WT, wild-type; TG, ATRAP transgenic mice; Ang II, angiotensin II; AUC, area under the curve.

