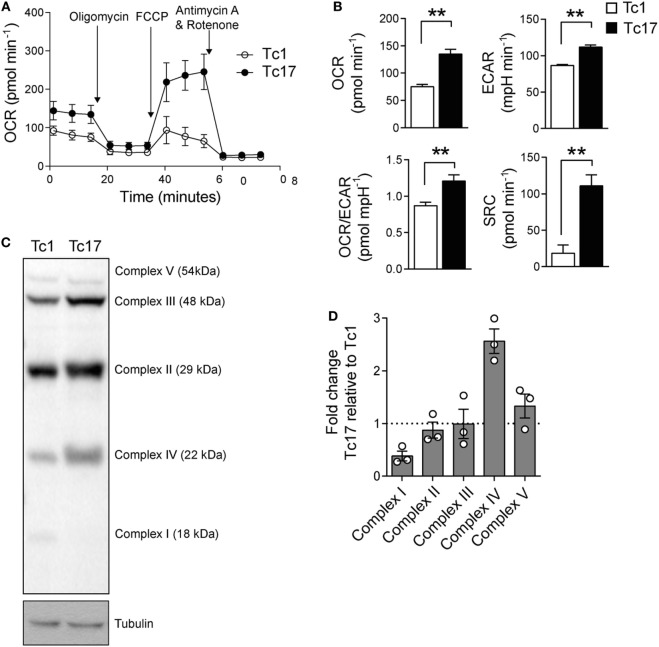
Figure 5.
Tc17 cells present a metabolic profile of memory T cells. (A,B) Oxygen consumption rates (OCRs) and extracellular acidification rates (ECARs) from in vitro-generated Tc1 and Tc17 cells were measured under basal conditions and in response to 1 µM oligomycin, 0.5 µM fluoro-carbonyl cyanide phenylhydrazone, and 1 µM rotenone+ 1 µM antimycin A. Representative of two independent experiments. Two-tailed Mann–Whitney test, **p < 0.01, n = 6–7. (C) ETC Complex I, II, III, IV, and V proteins were analyzed by western blot in Tc17 and Tc1 cells. Representative of three independent experiments. (D) Quantification of ETC complexes, n = 3.

