Figure 1.
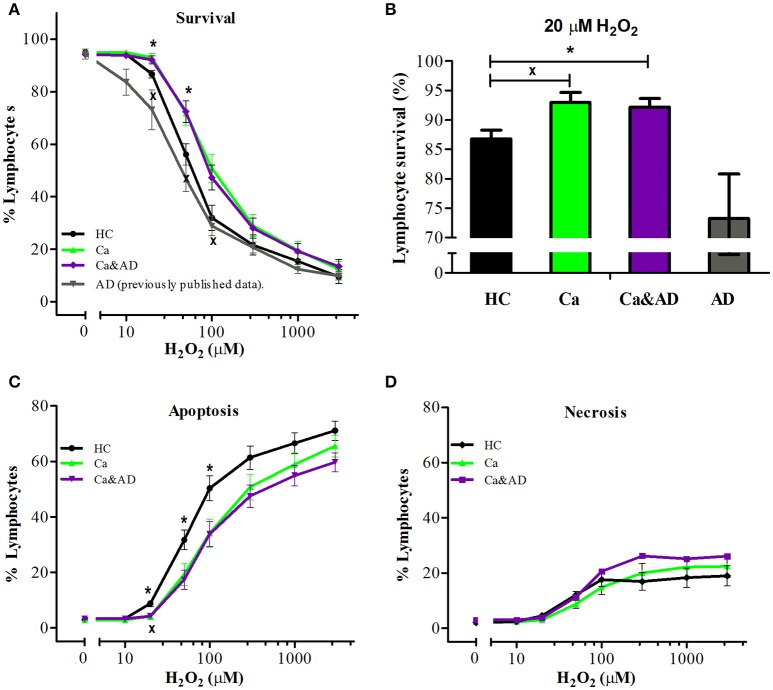
H2O2-induced death of lymphocytes from cancer, cancer & AD and healthy controls. Lymphocytes from 11 cancer patients (Ca; green symbols), 13 cancer & AD (Ca&AD; purple symbols) patients, and 12 healthy controls (HC; black symbols) were exposed to different concentrations of H2O2 for 20 h and death was determined by flow cytometry with propidium iodide staining. (A) Lymphocyte survival curve at increasing concentrations of H2O2; (B) Survival values at 20 μM H2O2; (C,D) apoptosis and necrosis curves, respectively, from experiments in A (%, means ± SE). The results previously reported (Salech et al., 2017) on AD lymphocytes were added in A and B for comparison. xCa vs. HC, *Ca&AD vs. HC. 1 symbol: p < 0.05; 2 symbols: p < 0.005; 3 symbols: p < 0.0001 for all figures.

