Figure 4.

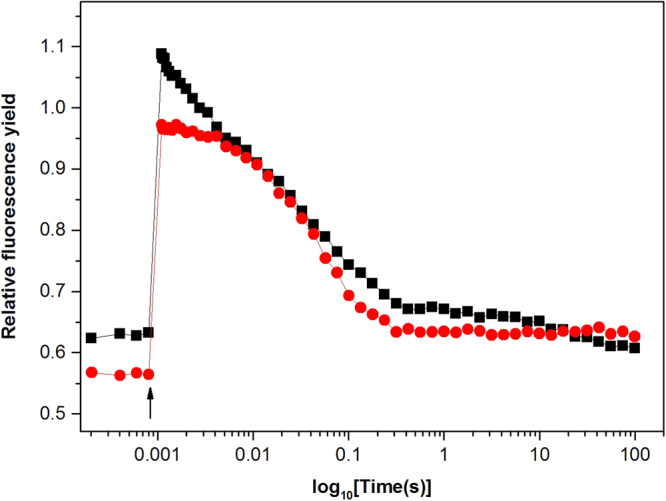
Flash induced fluorescence decay kinetics from the re-oxidized double reduced PS II membrane samples. Traces indicate the fluorescence yield changes after a single flash in the presence (red) or in the absence (black) of DCMU.

Flash induced fluorescence decay kinetics from the re-oxidized double reduced PS II membrane samples. Traces indicate the fluorescence yield changes after a single flash in the presence (red) or in the absence (black) of DCMU.