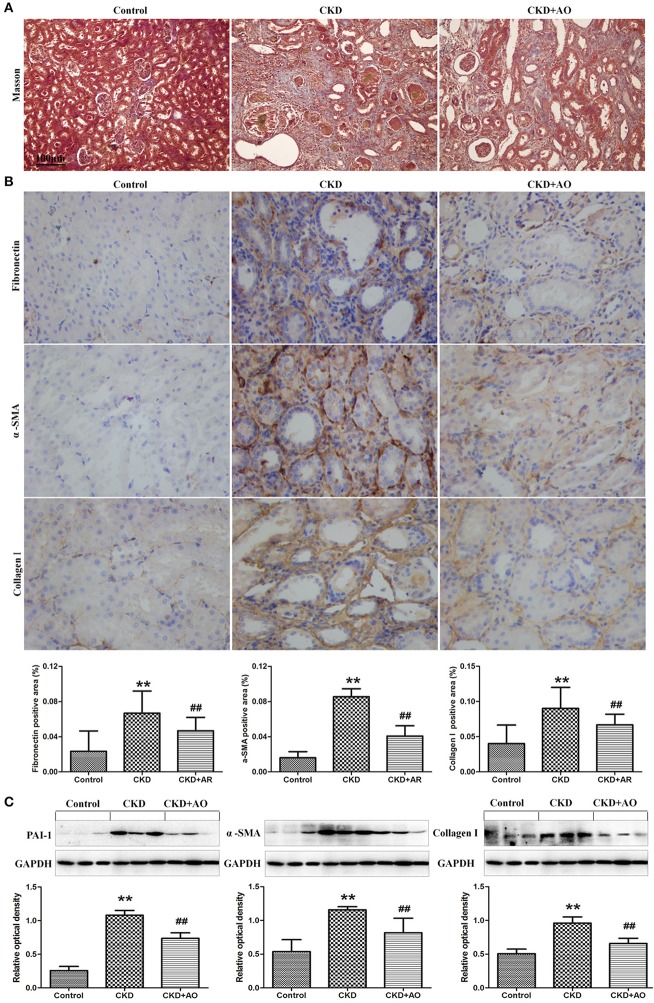
Figure 5.
Masson staining and Western blot analysis of kidney tissue. (A) Representative images of Masson stained kidney sections from control, adenine-induced CKD and CKD+AO groups. (B) Immunohistochemical findings with anti-Fibronectin, α-SMA and Collagen I antibodies in the control, adenine-induced CKD and CKD+AO groups of rat kidneys. (C) Protein expression of PAI-1, α-SMA, and collagen I in the renal tissues of control, adenine-induced CKD and CKD+AO groups. **p < 0.01 compared with control group; ##p < 0.01 compared with CKD group. The data are presented as the mean ± SD (n = 8 in each group).

