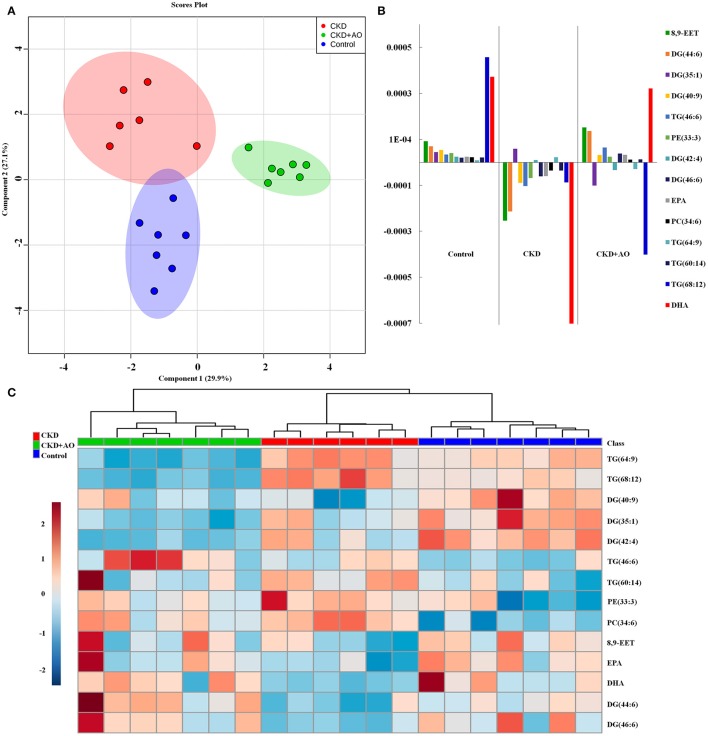
Figure 7.
Lipid metabolite identification and correlation analysis. (A) PCA of two components of 14 lipid species from control, adenine-induced CKD, and CKD+AO groups. (B) Correlation coefficient analysis of 14 lipid species among control, adenine-induced CKD, and CKD+AO groups. (C) Heatmap of 14 lipid species among control, adenine-induced CKD and CKD+AO groups. Red and blue indicate increased and decreased levels, respectively.

