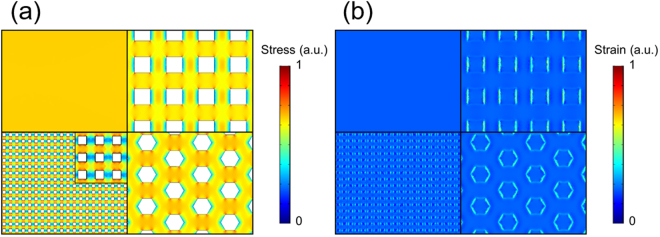
Figure 3.
Simulation results. (a) ITO stress in the vicinity of the ITO/PET interface. (b) PET strain in the vicinity of the ITO/PET interface. The upper left image is a planar ITO electrode. The upper right image is a square mesh-patterned ITO electrode. The lower left image is a fine square mesh-patterned ITO electrode. The lower right image is a honeycomb mesh-patterned ITO electrode. Inset: Enlarged image of the result for the fine square mesh-patterned ITO electrode.

