
FIGURE 3.
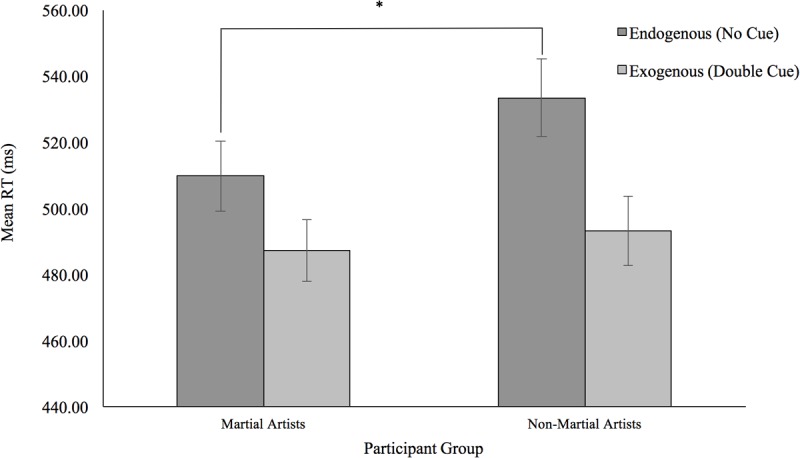
Graph depicting the mean RT for the trial types that make up the Alert index, no cue trials and double cue trials. Mean RTs are displayed for both participant groups. Error bars represent Standard Error. ∗p < 0.05.
Official websites use .gov
A
.gov website belongs to an official
government organization in the United States.
Secure .gov websites use HTTPS
A lock (
) or https:// means you've safely
connected to the .gov website. Share sensitive
information only on official, secure websites.
Graph depicting the mean RT for the trial types that make up the Alert index, no cue trials and double cue trials. Mean RTs are displayed for both participant groups. Error bars represent Standard Error. ∗p < 0.05.