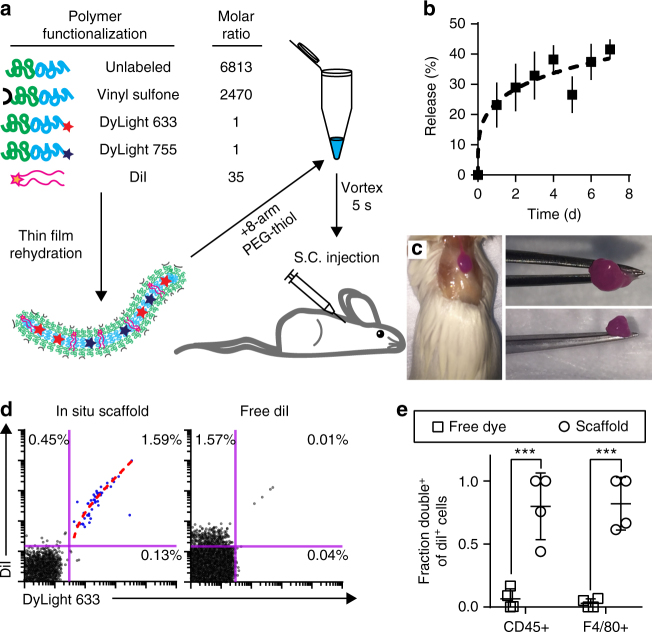
Fig. 5.
Graphical depiction of modular PEG-bl-PPS FM-scaffold preparation for in situ scaffold crosslinking and in vivo delivery. a Schematic of DiI-loaded PEG-bl-PPS FM modularly assembled from four separate BCPs for in situ crosslinking into FM-scaffolds and multimodal analysis following subcutaneous (S.C.) injection. b Intravital fluorescence imaging (IVIS) of cumulative MC (DyLight 755) release from in situ crosslinked FM-scaffolds containing 20% w/w VS-BCP over 7 days. Error bars represent SEM, n = 3. c Excised crosslinked scaffold 1 week after subcutaneous injection. d Representative flow cytometric dot plots displaying uptake of intact (double positive DiI+ DyLight 633+) released MCs by CD45+ cells recovered from the spleens of mice receiving injections of either DiI-loaded in situ crosslinked modular FM-scaffolds or free solubilized DiI in PBS. Percentages of events within the quadrant gates out of all events in the graph are shown. Linear fit (dotted, red) is overlaid upon the DiI+ DyLight 633+ events (blue dots), adjusted r2 = 0.9773 from Pearson’s correlation coefficient. Both axes are on a logarithmic scale. e Quantification of MC (DyLight 633) and DiI uptake by CD45+ or F4/80+ cells recovered from the spleen of mice receiving either DiI-loaded in situ crosslinked FM-scaffolds or free DiI. The y-axis represents the fraction of all DiI+ cells that were also DiI+ DyLight 633+ double positive. Lower fractions suggest separate uptake of solubilized DiI alone while higher fractions received intact MCs and thus both DiI and DyLight 633 simultaneously. Error bars represent s.d., n = 4 for both groups. Significance between groups assessed by Mann–Whitney U test, ***p < 0.001

