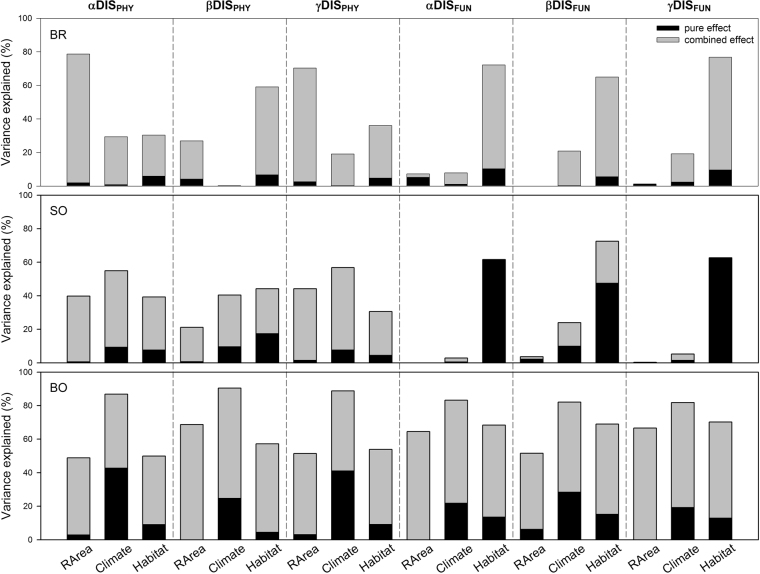
Figure 3.
Variation partitioning of the three components (α, β and γ) of phylogenetic and functional diversity derived in elevational bands explained by regional area, climate and habitat heterogeneity along the three study transects. The black bars indicate the individual effects and the grey bars indicate the combined effects. Because the variance in αDISFUN and βDISFUN explained by regional area along the SO and BR transects, respectively, is very low (0.1%), the effects are not shown in this figure. The abbreviations for the study transects, explanatory variables and diversity indices are defined in Table 2. DISPHY and DISFUN indicate phylogenetic and functional dispersion, respectively.

