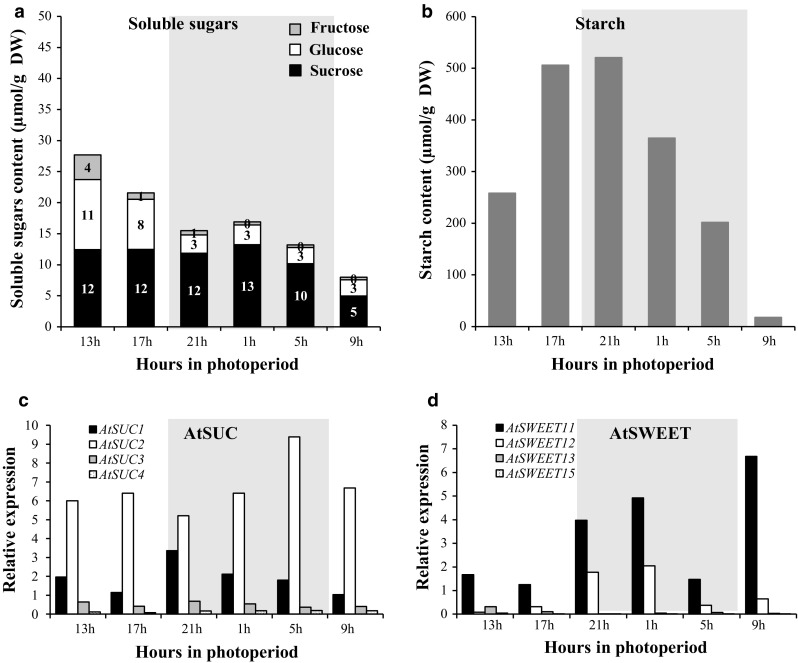
Fig. 2.

Sugar content and expression pattern of sucrose transporter AtSUC and AtSWEET genes in leaves during a 24-h cycle in 31-day-old A. thaliana plants grown hydroponically. Measurements of sucrose (black), glucose (white), fructose (light grey) (a), and starch contents in leaves (b). Data are expressed as the mean of measures obtained from pools of five plants. Relative expression of AtSUC1–4 (c) and of AtSWEET11, 12, 13, and 15 (d) was determined by RT-qPCR. Data are expressed as normalized expression (no unit) to the reference gene At5g12240 expression level (Czechowski et al. 2005) and are the mean of measures obtained from pools of five plants
